
How to Create a Profit and Loss Detail Report (Detail View) in QuickBooks Online
When a Profit and Loss summary raises a question (why did travel expense spike this month?), the Detail report is where you find the answer. It lists every transaction behind each account, not just the totals.
New to QuickBooks Online's modern view? See how it compares to the classic view.
Steps
- Open the Profit and Loss Detail report
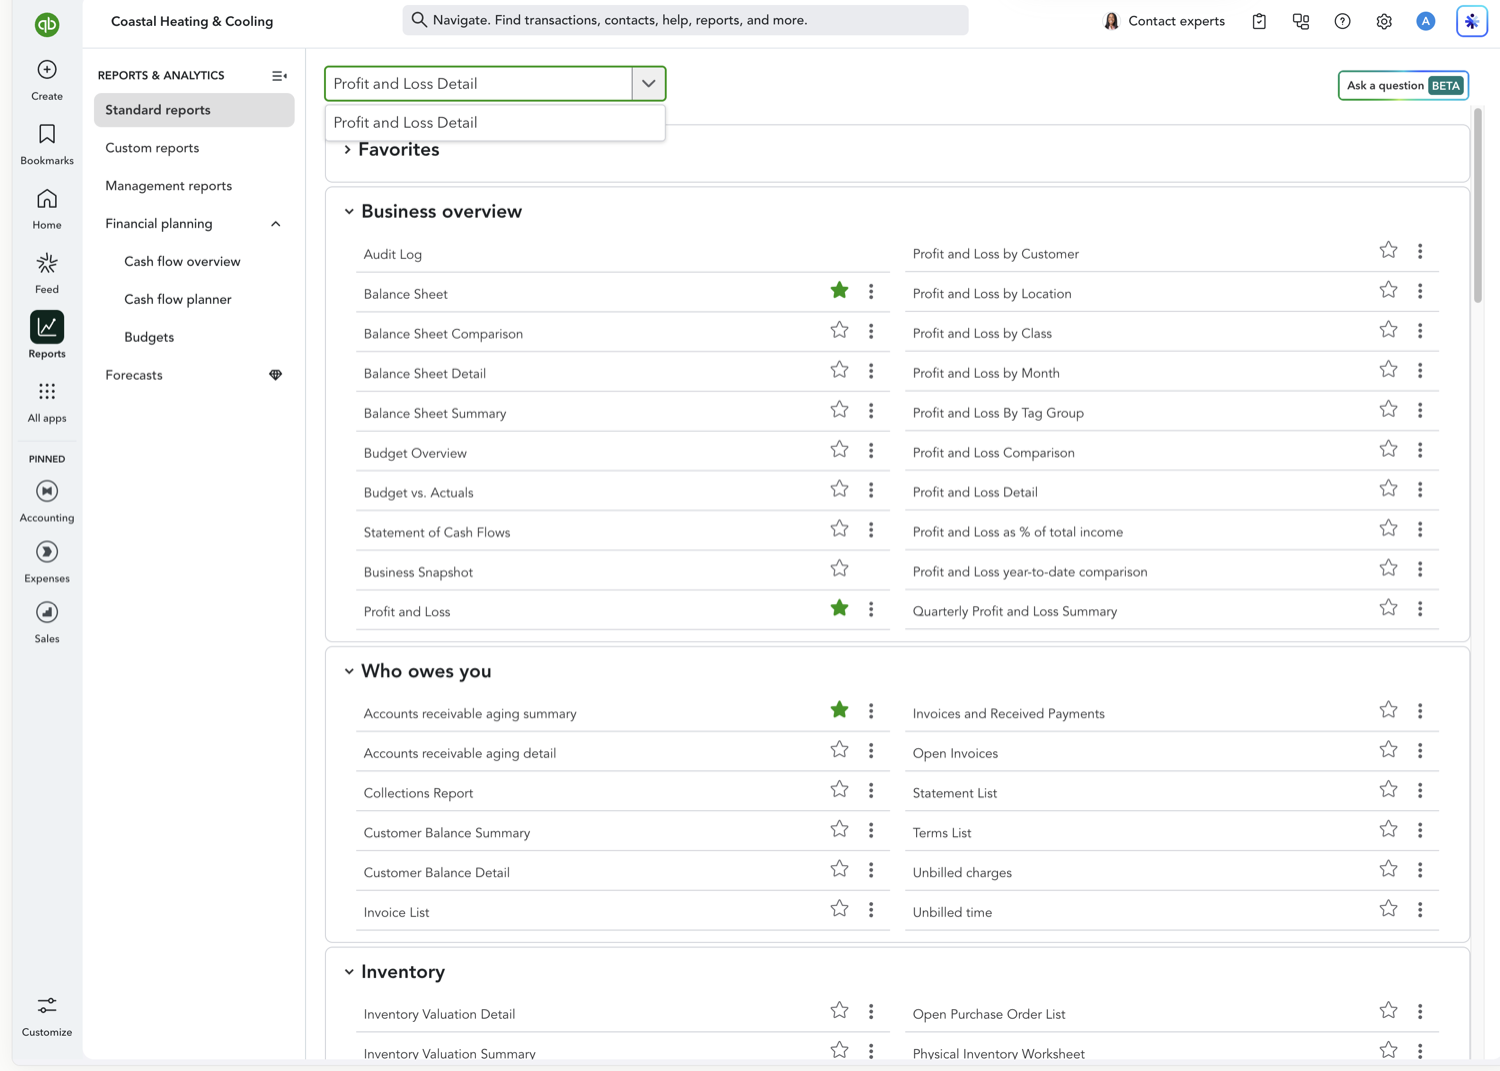
Go to Reports and search for "Profit and Loss Detail" (distinct from the standard summary "Profit and Loss" report).
- Set your date range
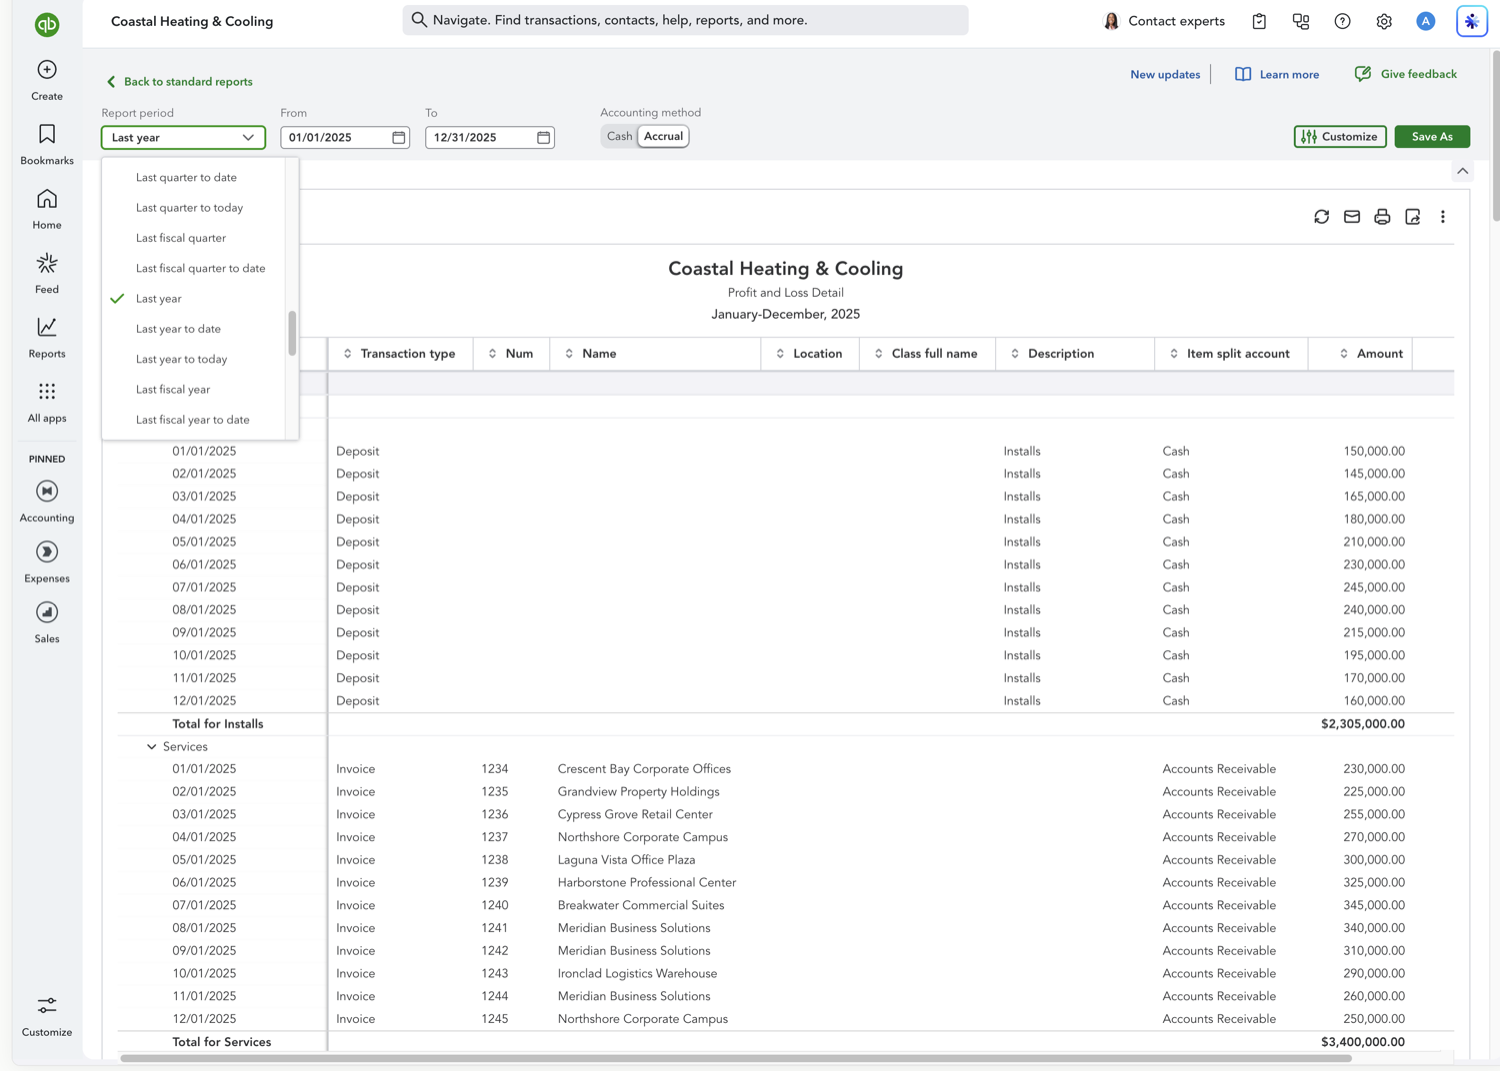
Choose the period you want to investigate, often a single month when you're drilling into a specific variance.
- Filter to the accounts you care about (optional)
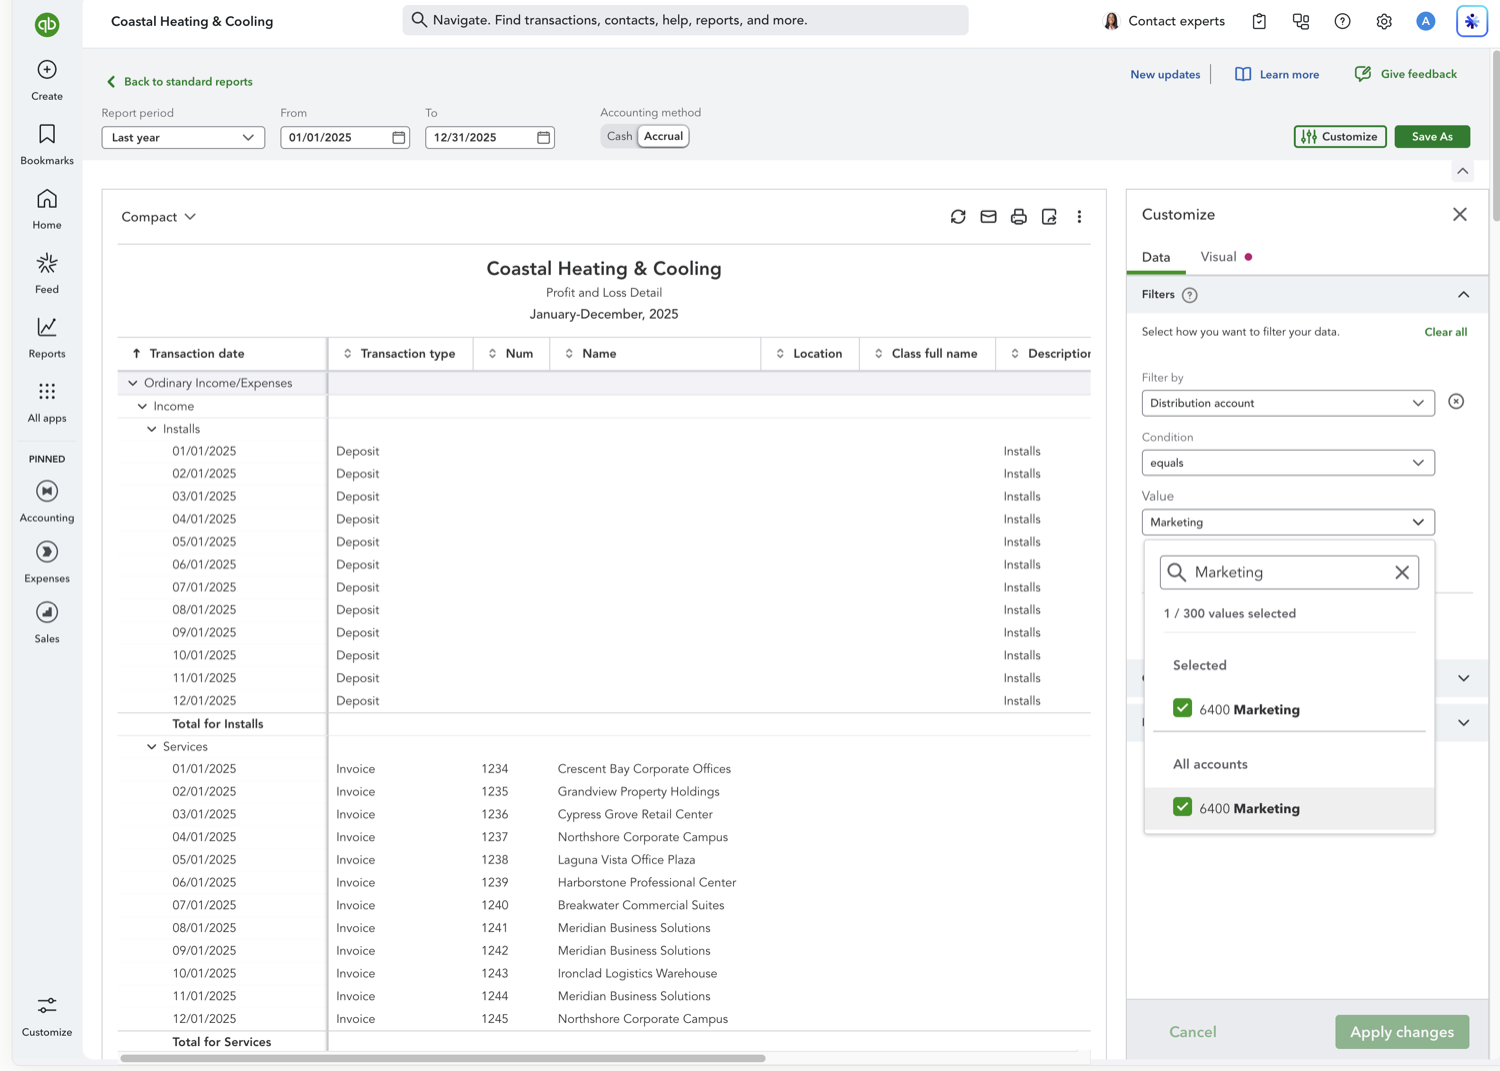
Click Customize, open the Filters section, and set "Filter by" to an option like Distribution account (or Customer, or Class) to investigate part of the report rather than every transaction.
- Review the transaction list
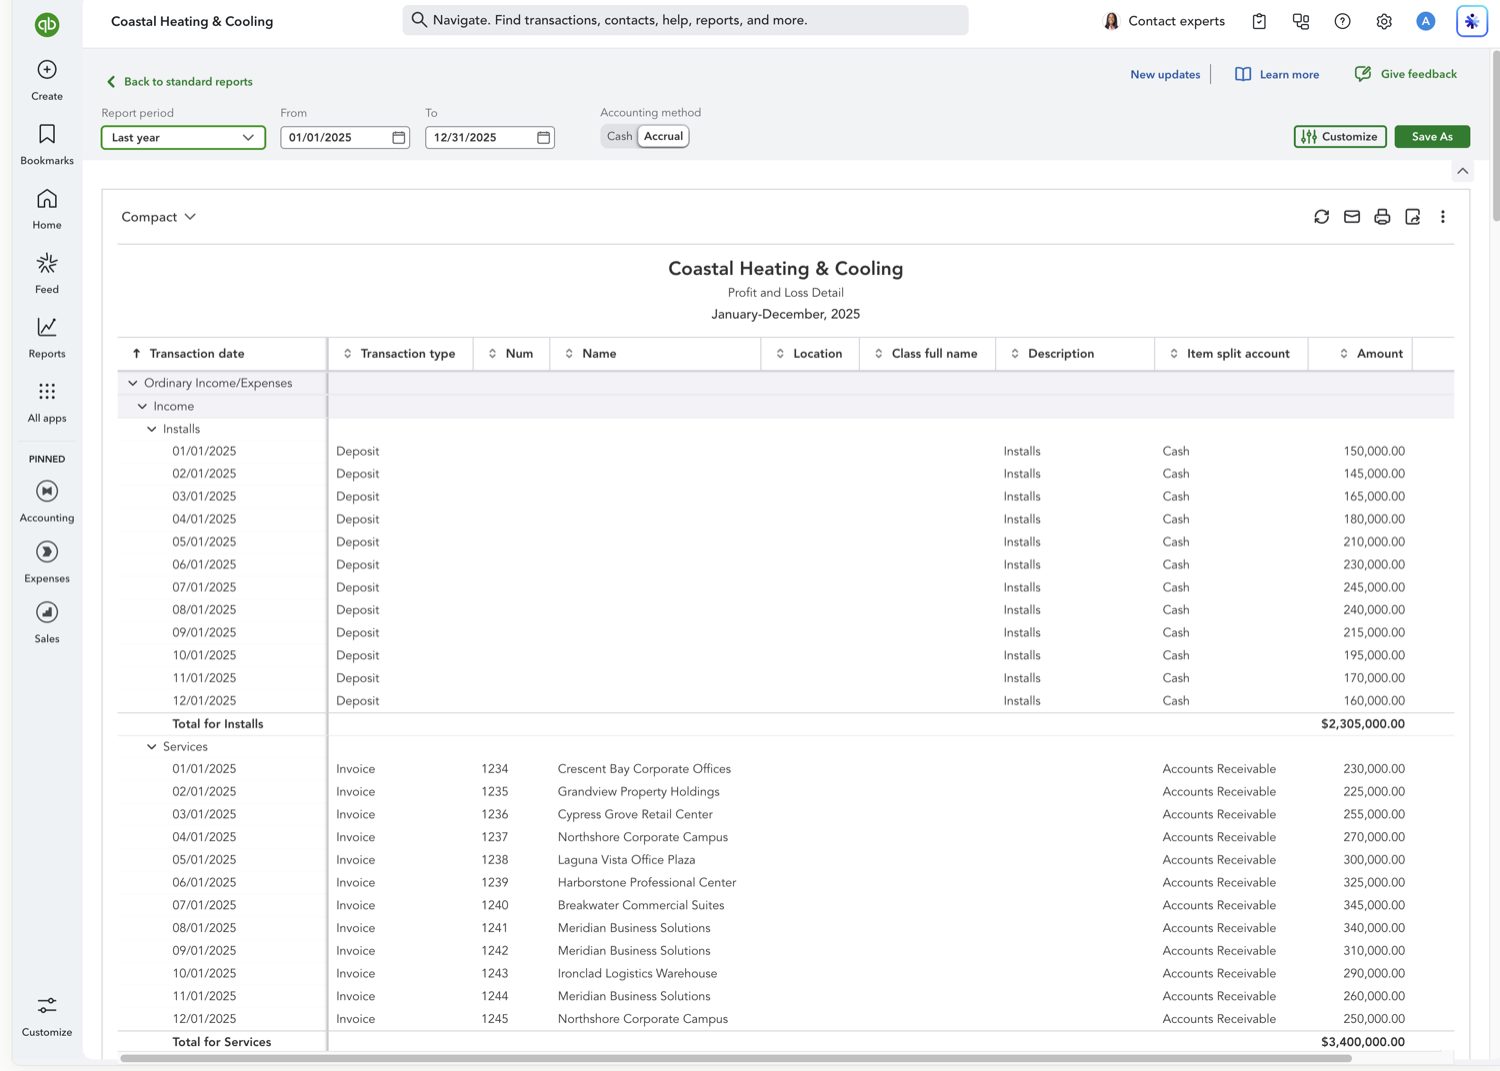
The report updates automatically, listing every transaction (bills, invoices, journal entries, and more) grouped under each income and expense account, with running totals.
See also
Frequently asked questions
Can I click into a transaction from the Detail report?
Yes. Every line in the Profit and Loss Detail report is clickable and opens the original transaction (bill, invoice, journal entry, etc.) so you can review or edit it directly.
Is this the same as the Transaction Detail by Account report?
They're closely related. Profit and Loss Detail is scoped to income statement accounts specifically, while Transaction Detail by Account covers a broader set of account types including balance sheet accounts.
Why is this report so much slower to load than the summary version?
It's pulling every individual transaction rather than pre-aggregated totals, so large date ranges or high transaction volume will take noticeably longer to run. Narrowing the date range or filtering to specific accounts speeds it up.
Tired of rebuilding reports? Need more customization?
Retriever pulls QuickBooks Online reports like this one into Google Sheets on a schedule. They refresh on their own, and once the data is in Sheets you can pivot, chart, and customize it far beyond QuickBooks' fixed report layouts.
See how Retriever worksRelated report guides
Questions about this report? Reach out at aubrey@retrieverhq.com.

© 2026 Avalon Innovation Corporation. All rights reserved.
🇺🇸 Built in Orange County, California