
How to Create a Profit and Loss Report by Month in QuickBooks Online
Breaking your Profit and Loss out by month is the fastest way to spot seasonality, catch a spending spike early, and see whether revenue is trending up or down. Here's how to build one in QuickBooks Online's new modern view.
New to QuickBooks Online's modern view? See how it compares to the classic view.
Steps
- Open the Profit and Loss report
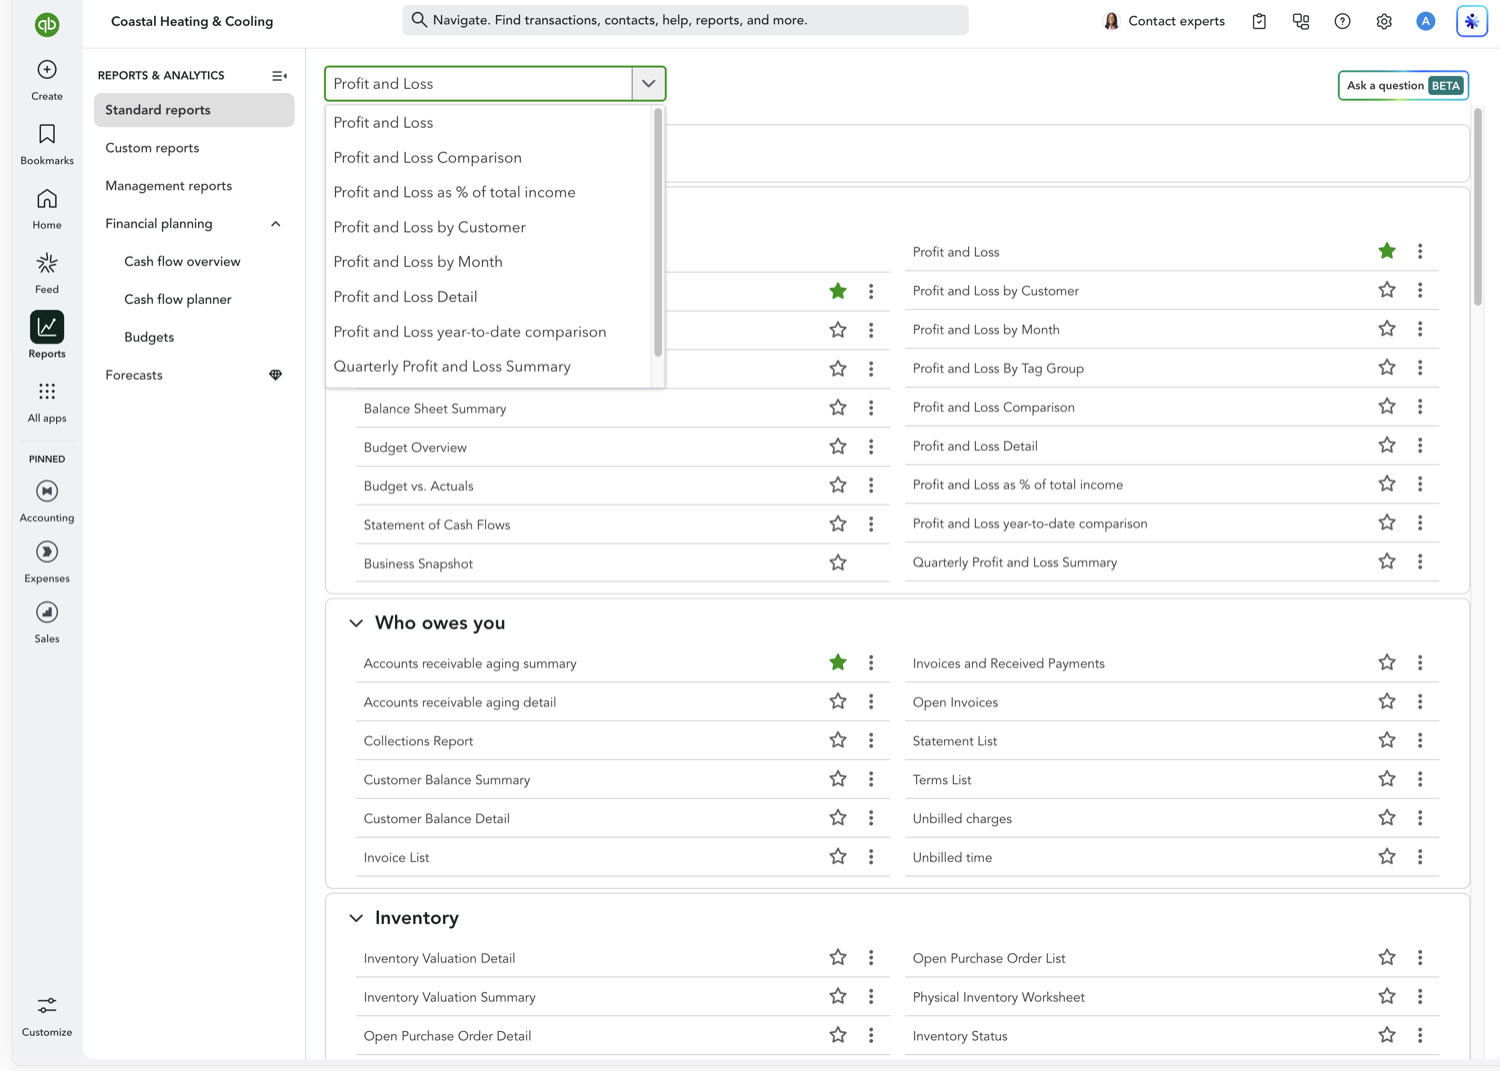
From the left navigation, go to Reports, then search for and select "Profit and Loss." QuickBooks will load the report with your default date range.
- Set your date range to the full period you want to compare
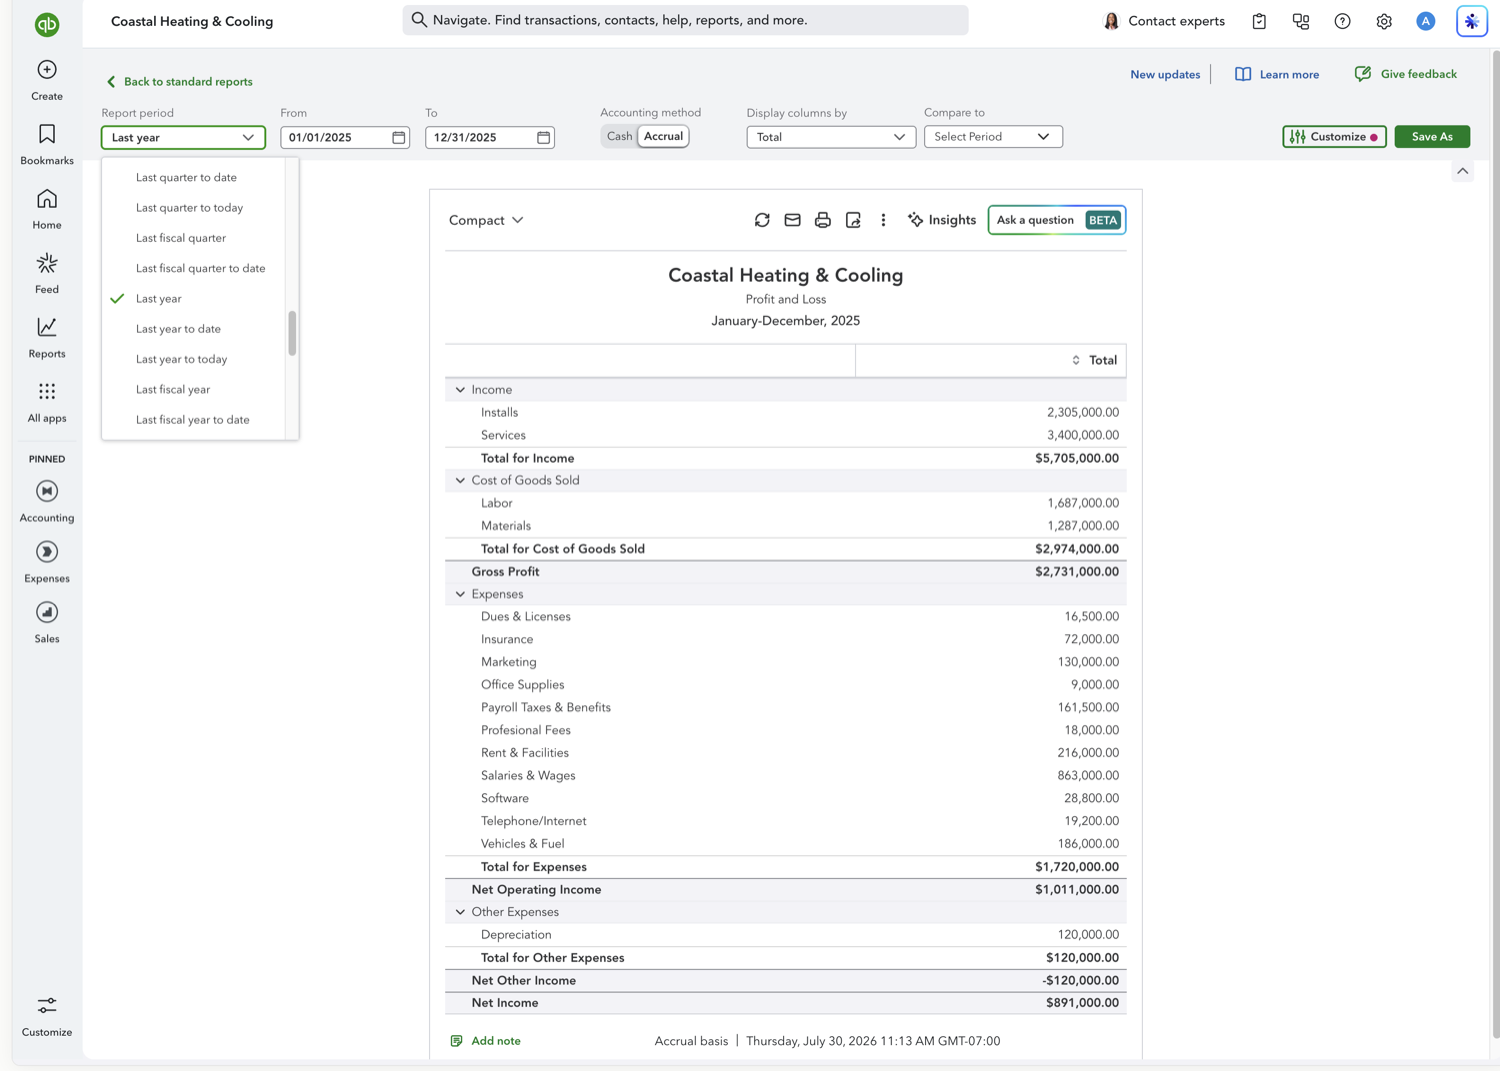
Use the date range control at the top of the report to select the period you want to analyze month-by-month, for example "This Year" or a custom range.
- Set the report to display columns by Months
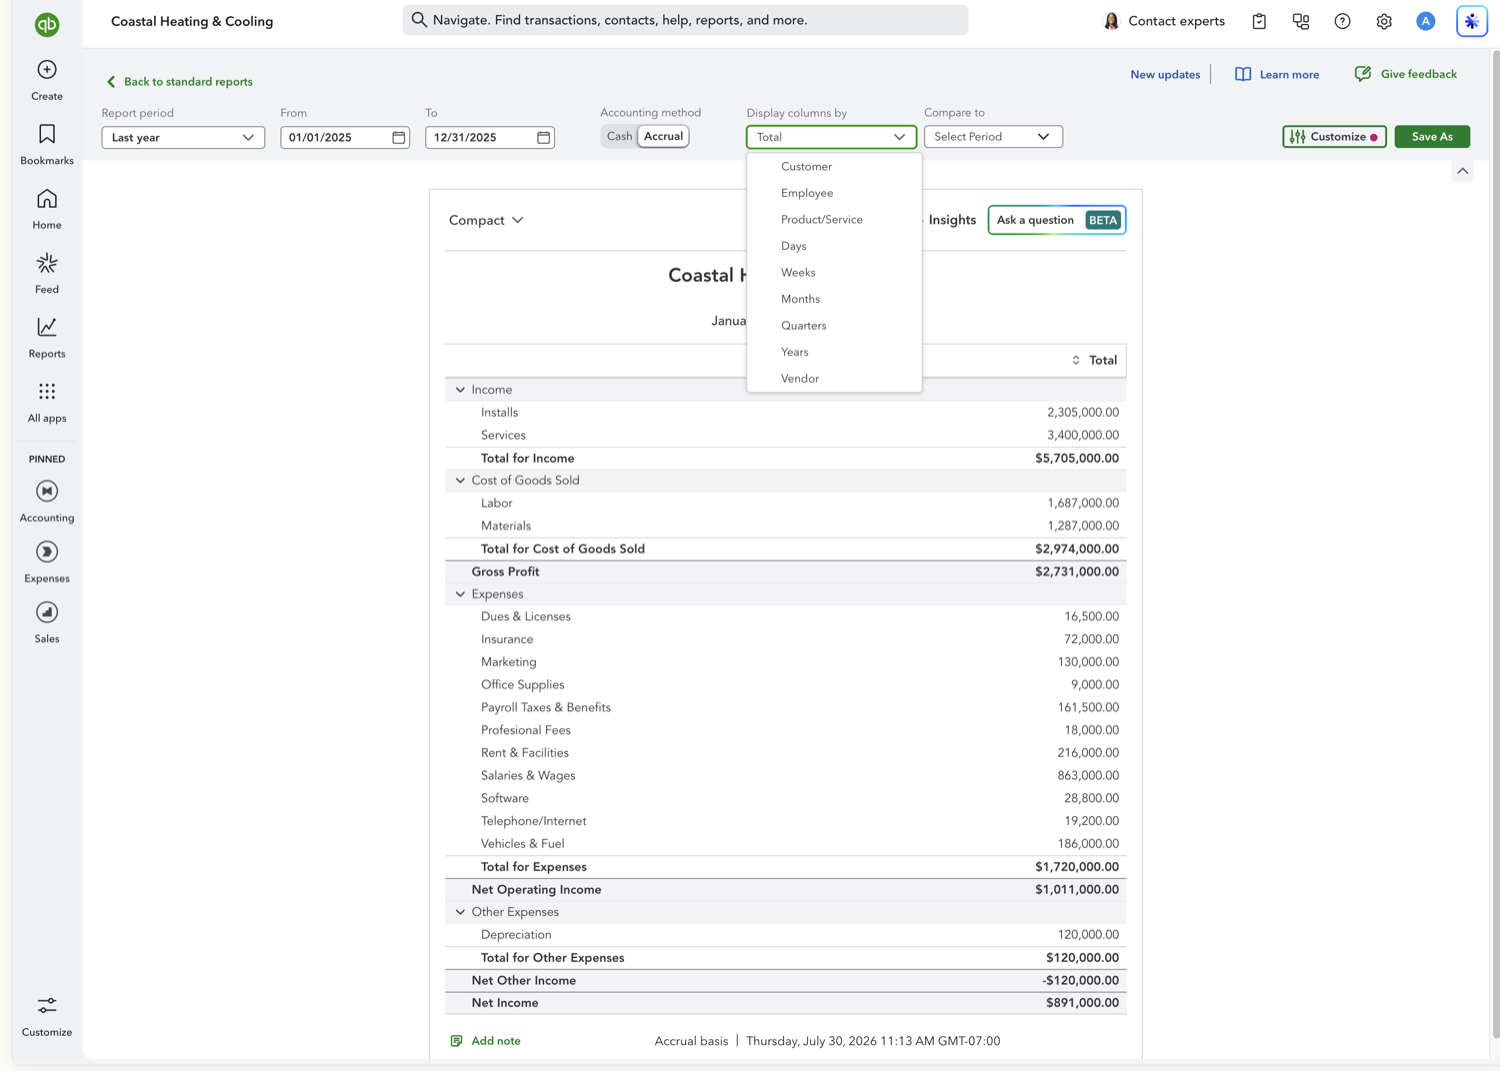
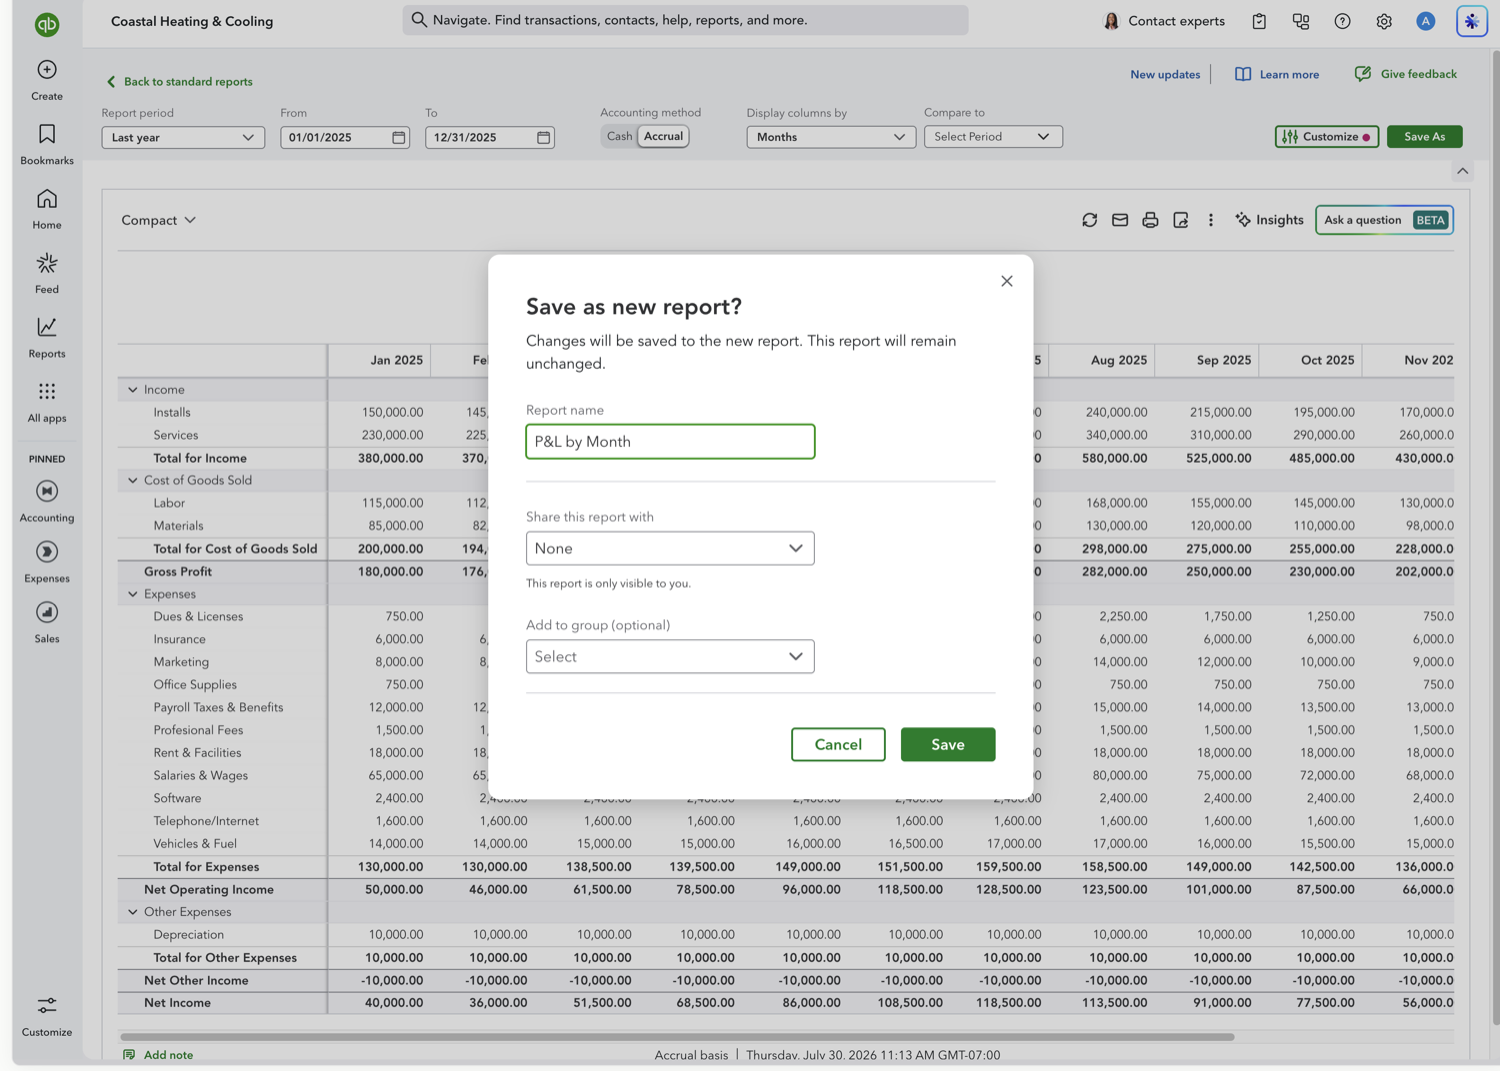
At the top of the report, open the "Display columns by" dropdown (next to the date fields) and choose Months. This splits every row of the report into one column per month. In the modern view this control lives right on the report toolbar, so you no longer need to open Customize for it.
- Review the monthly columns
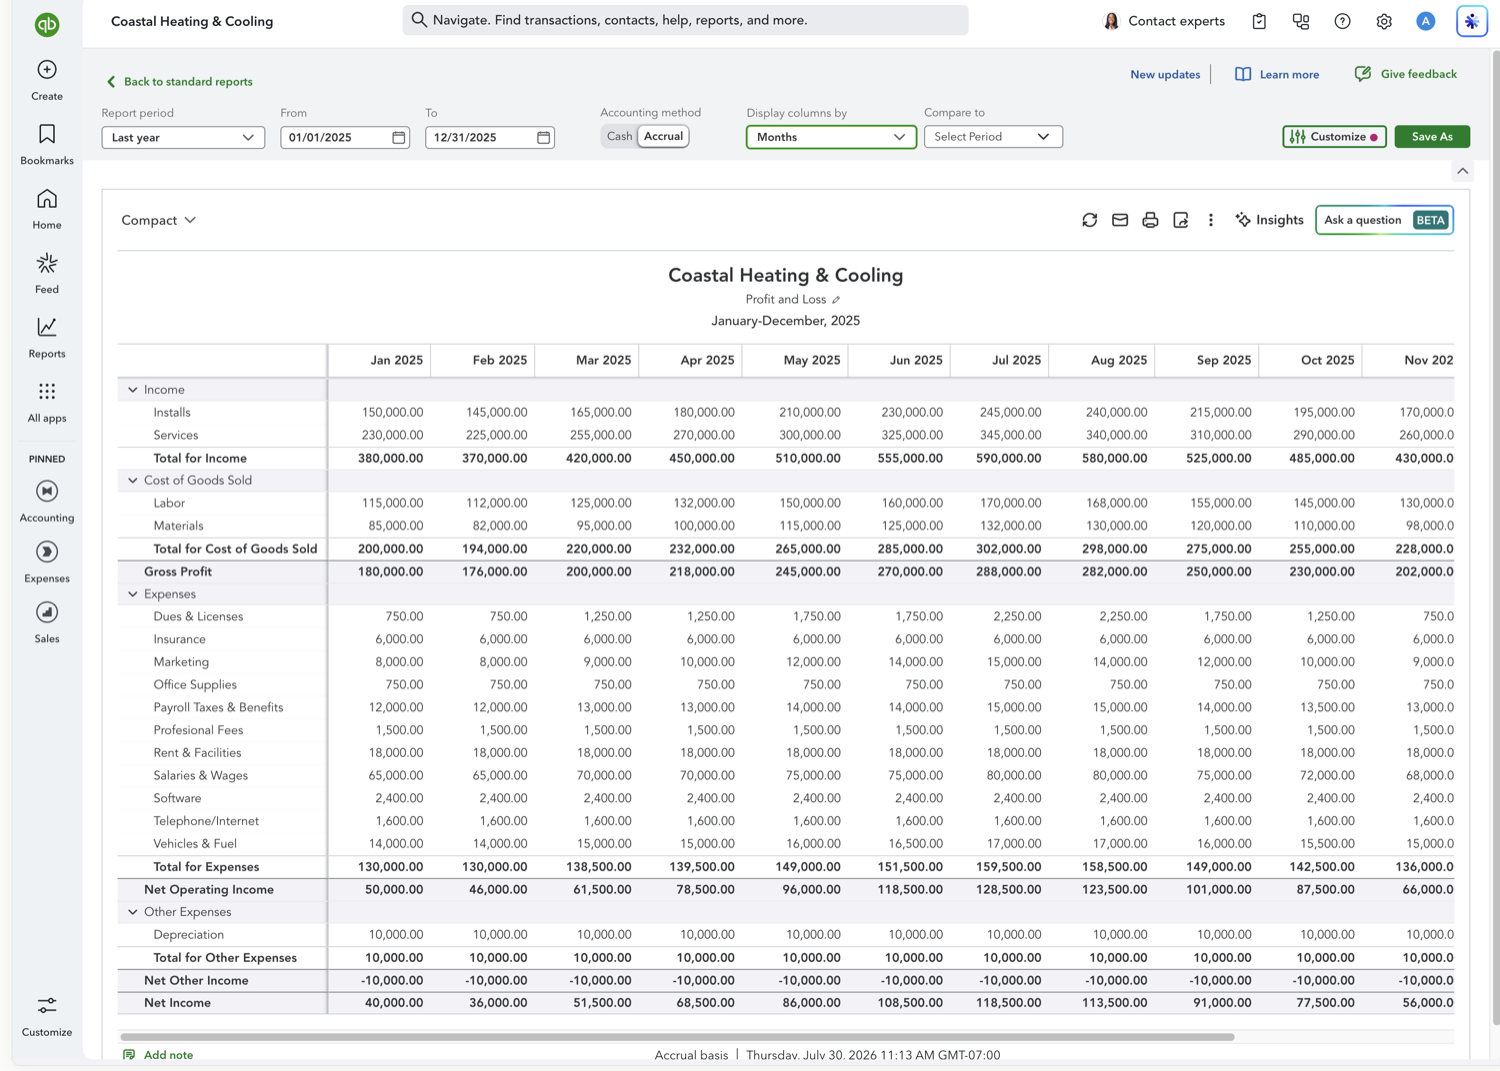
The report updates instantly. The modern view has no separate "Run report" button. You should now see a Profit and Loss statement with a separate column for each month in your date range, plus a Total column.
- Save it as a new report (optional)
If you'll run this report regularly, click Save As (top right), give it a name like "P&L by Month" in the "Save as new report?" dialog, and save. You can then reopen it under Custom reports without resetting the columns.
See also
Frequently asked questions
Can I export a monthly Profit and Loss report to Excel or Google Sheets?
Yes. QuickBooks Online lets you export any report to Excel from the Export icon above the report. For a live-refreshing version in Google Sheets instead of a static export, tools like Retriever can pull this same report directly into a spreadsheet on a schedule.
Why does my monthly P&L look different after the modern view update?
Intuit's modern view changed the report layout and moved several controls onto the report toolbar. The Profit and Loss report itself is unaffected. The by-month breakdown works the same way, just through the new "Display columns by" dropdown at the top of the report instead of the old Customize panel.
What is the difference between "by Month" and "by Quarter"?
Both use the same "Display columns by" dropdown at the top of the report: choose Months for 12 columns across a year, or Quarters for four columns. Use Months when you need to catch short-term trends, Quarters for a higher-level view.
Tired of rebuilding reports? Need more customization?
Retriever pulls QuickBooks Online reports like this one into Google Sheets on a schedule. They refresh on their own, and once the data is in Sheets you can pivot, chart, and customize it far beyond QuickBooks' fixed report layouts.
See how Retriever worksRelated report guides
Questions about this report? Reach out at aubrey@retrieverhq.com.

© 2026 Avalon Innovation Corporation. All rights reserved.
🇺🇸 Built in Orange County, California