
How to Create a Profit and Loss Report by Customer in QuickBooks Online
Not every customer is equally profitable. Splitting your Profit and Loss by customer shows you which relationships are actually driving margin, and which ones might be costing you more than they're worth.
New to QuickBooks Online's modern view? See how it compares to the classic view.
Steps
- Open the Profit and Loss report
Go to Reports in the left navigation and select "Profit and Loss" to open the report with its default settings.
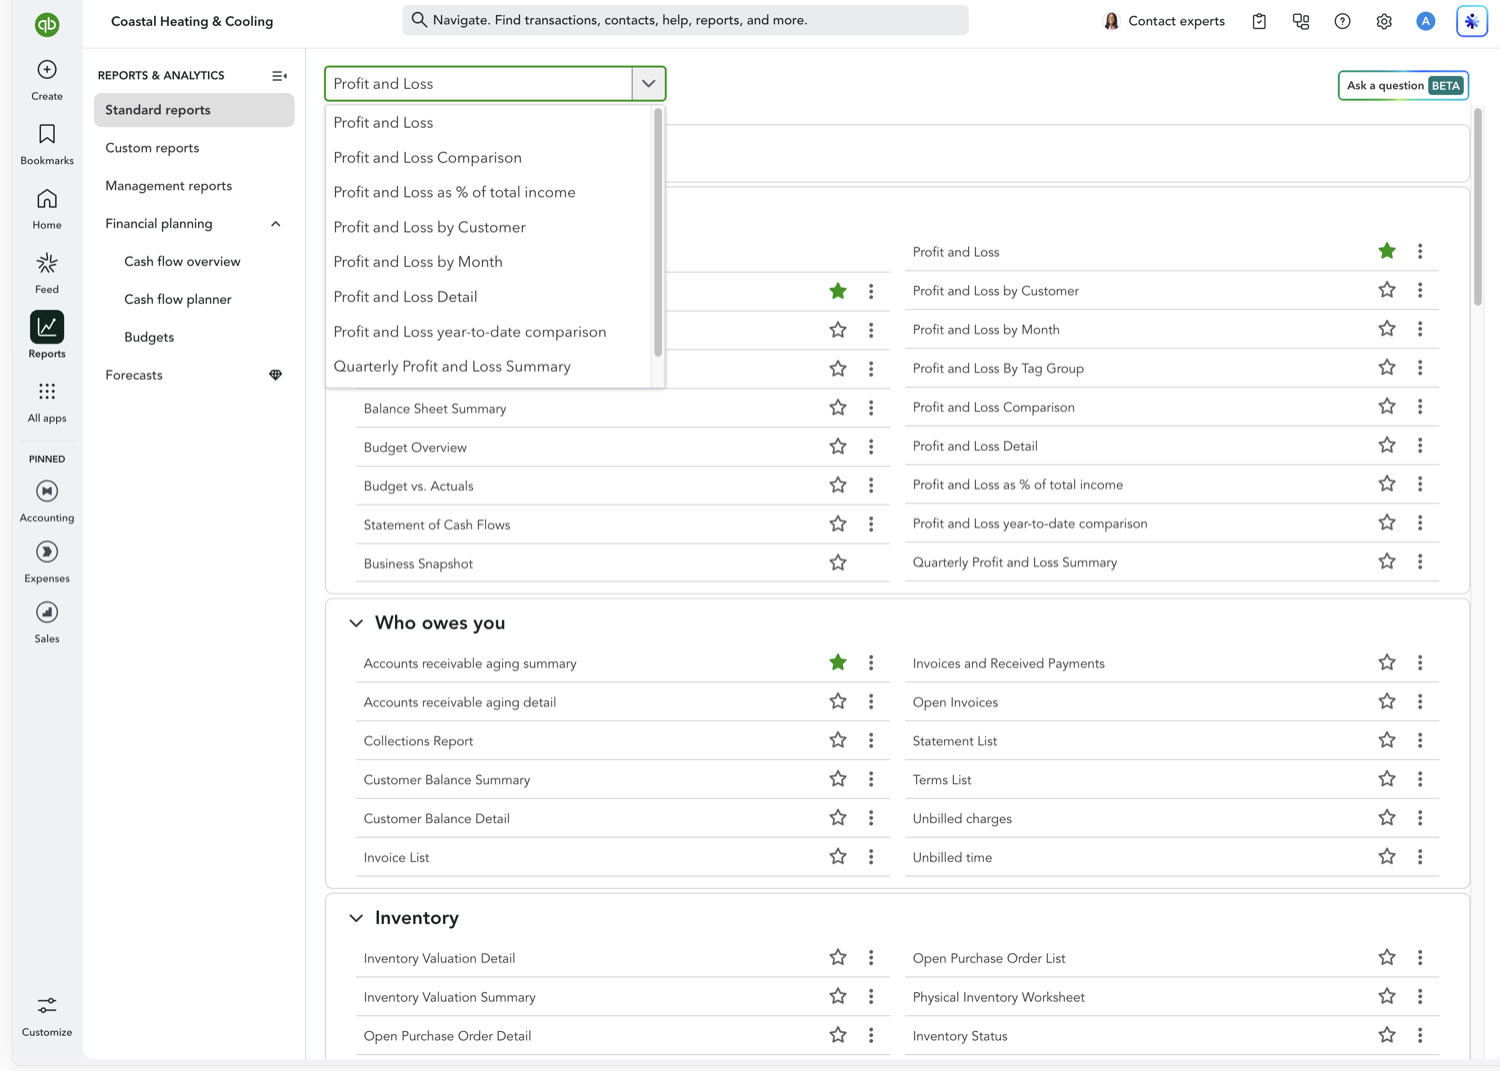
- Set your reporting period
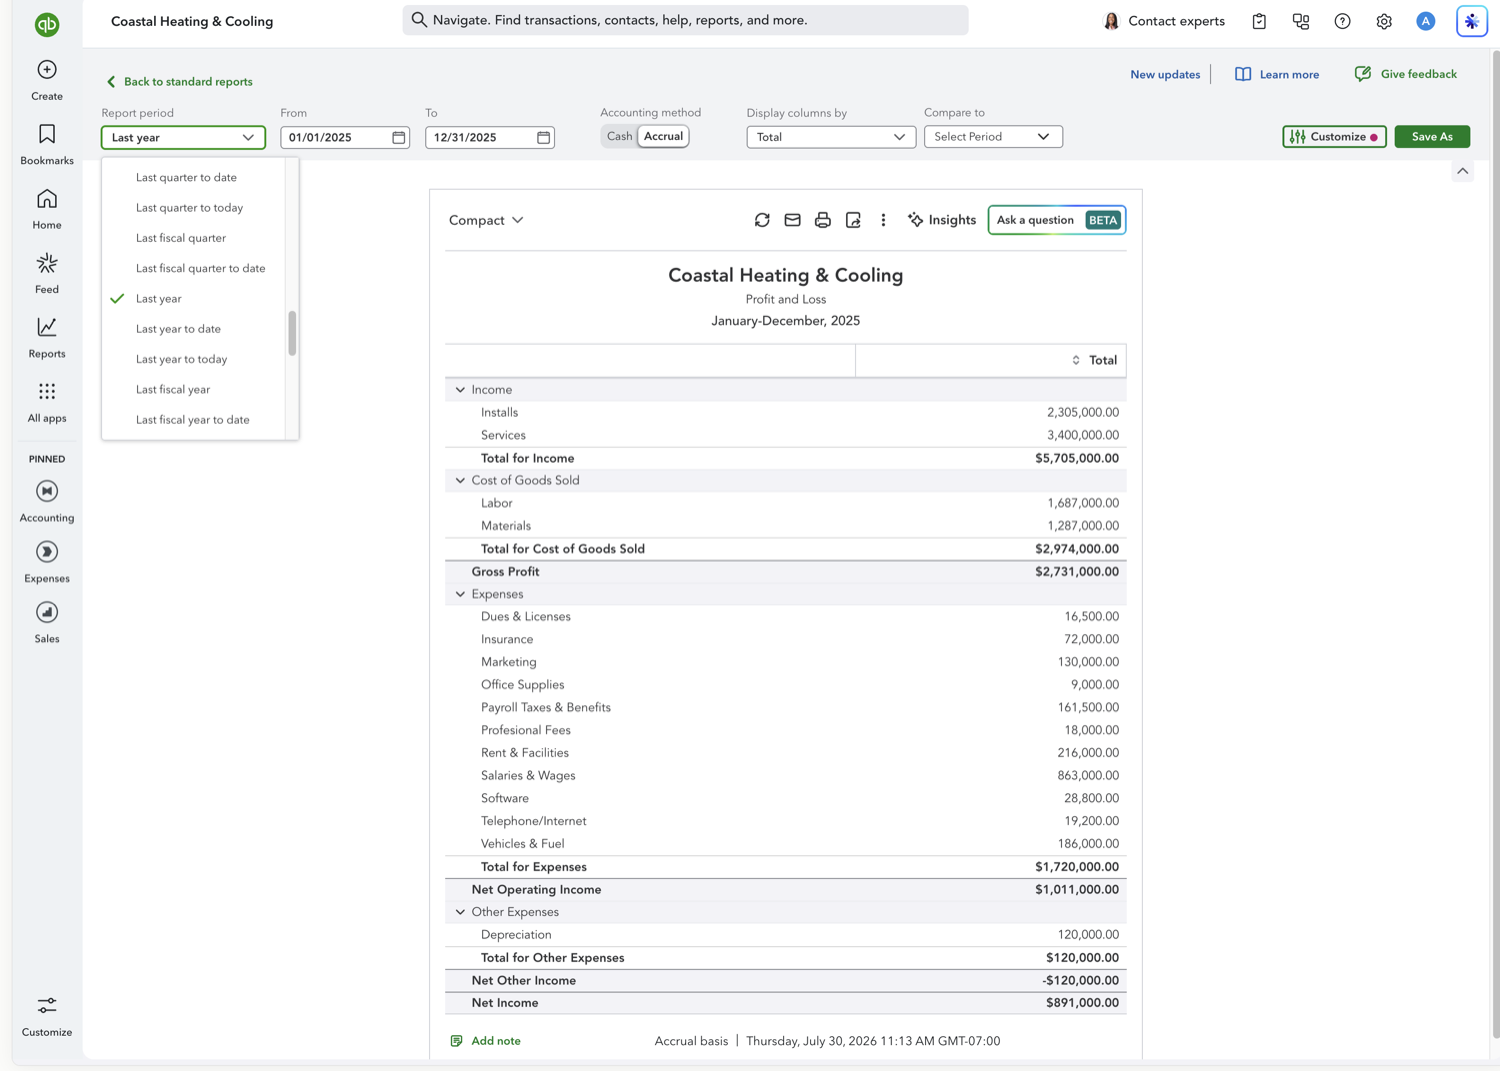
Choose the date range you want to evaluate. A full fiscal year is common for comparing customer profitability over time.
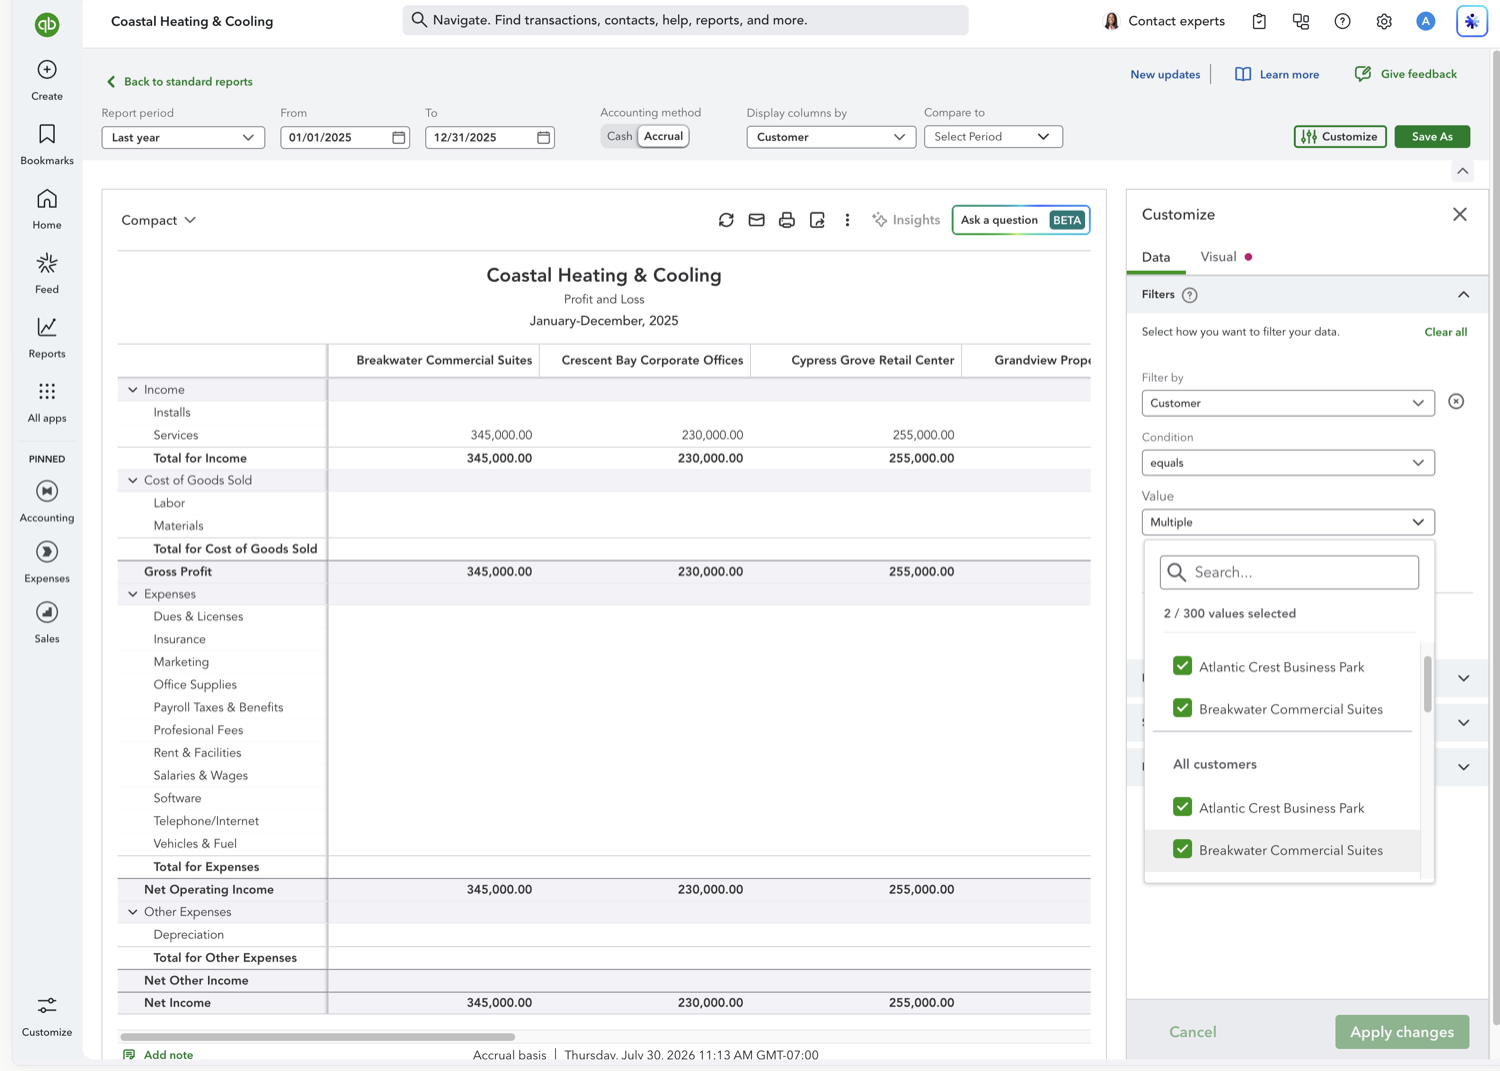
- Set the report to display columns by Customer
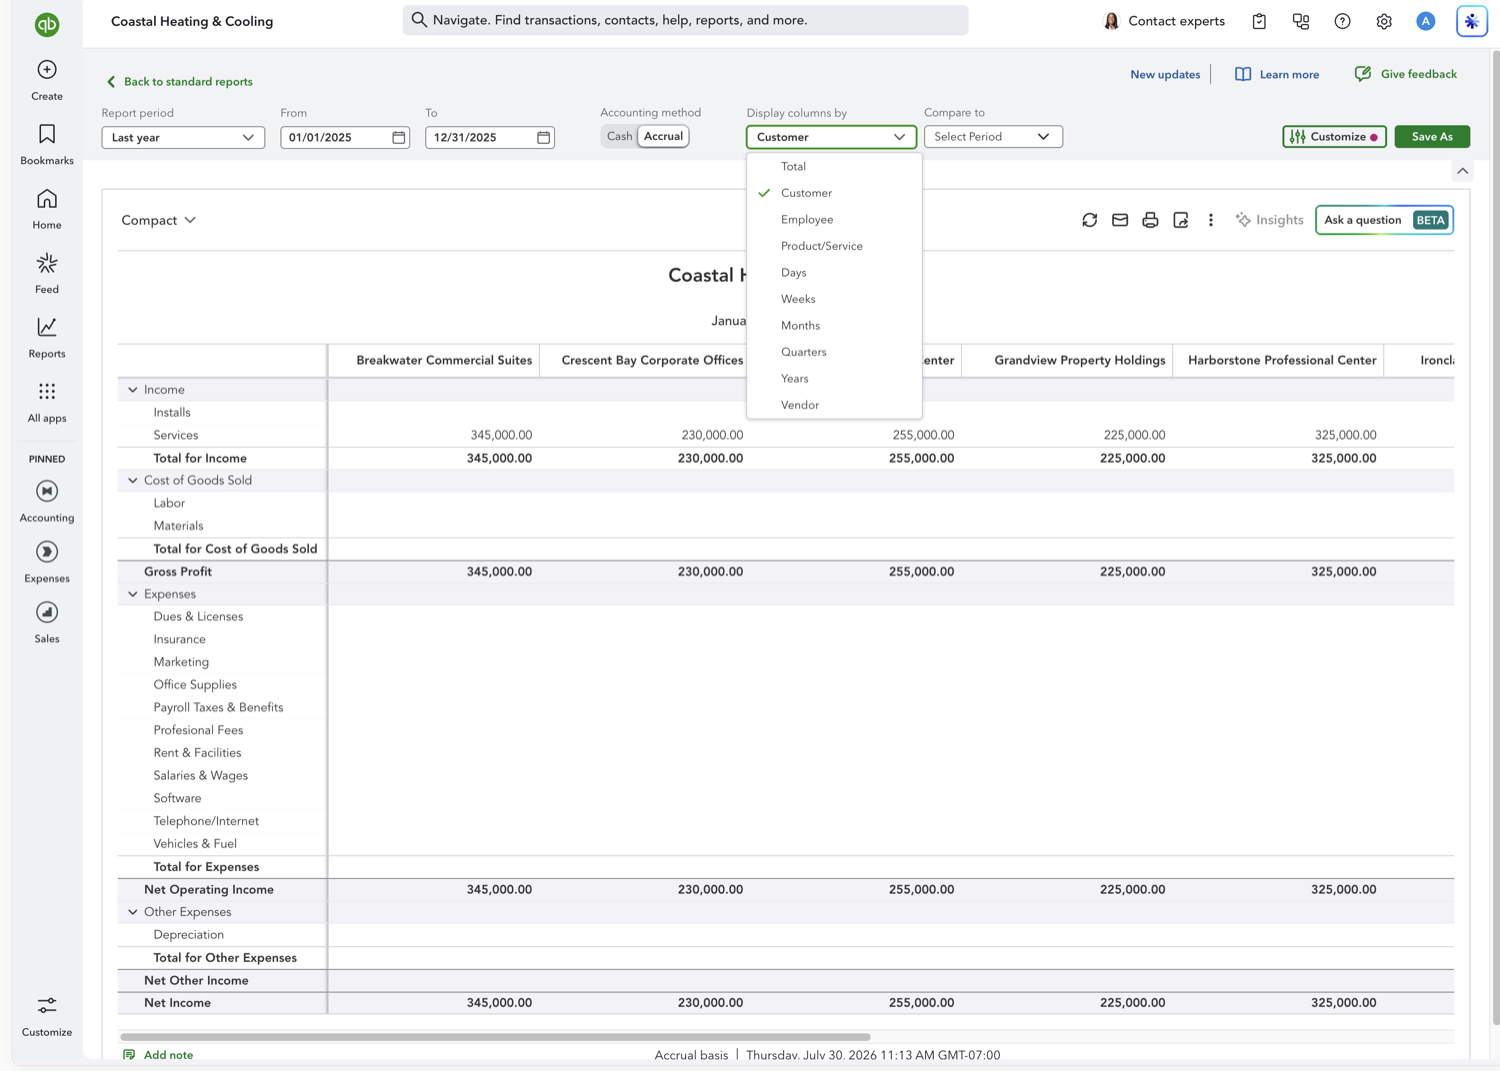
Open the "Display columns by" dropdown at the top of the report and choose Customer. Every income and expense row will now be split into one column per customer.
- Review the customer columns
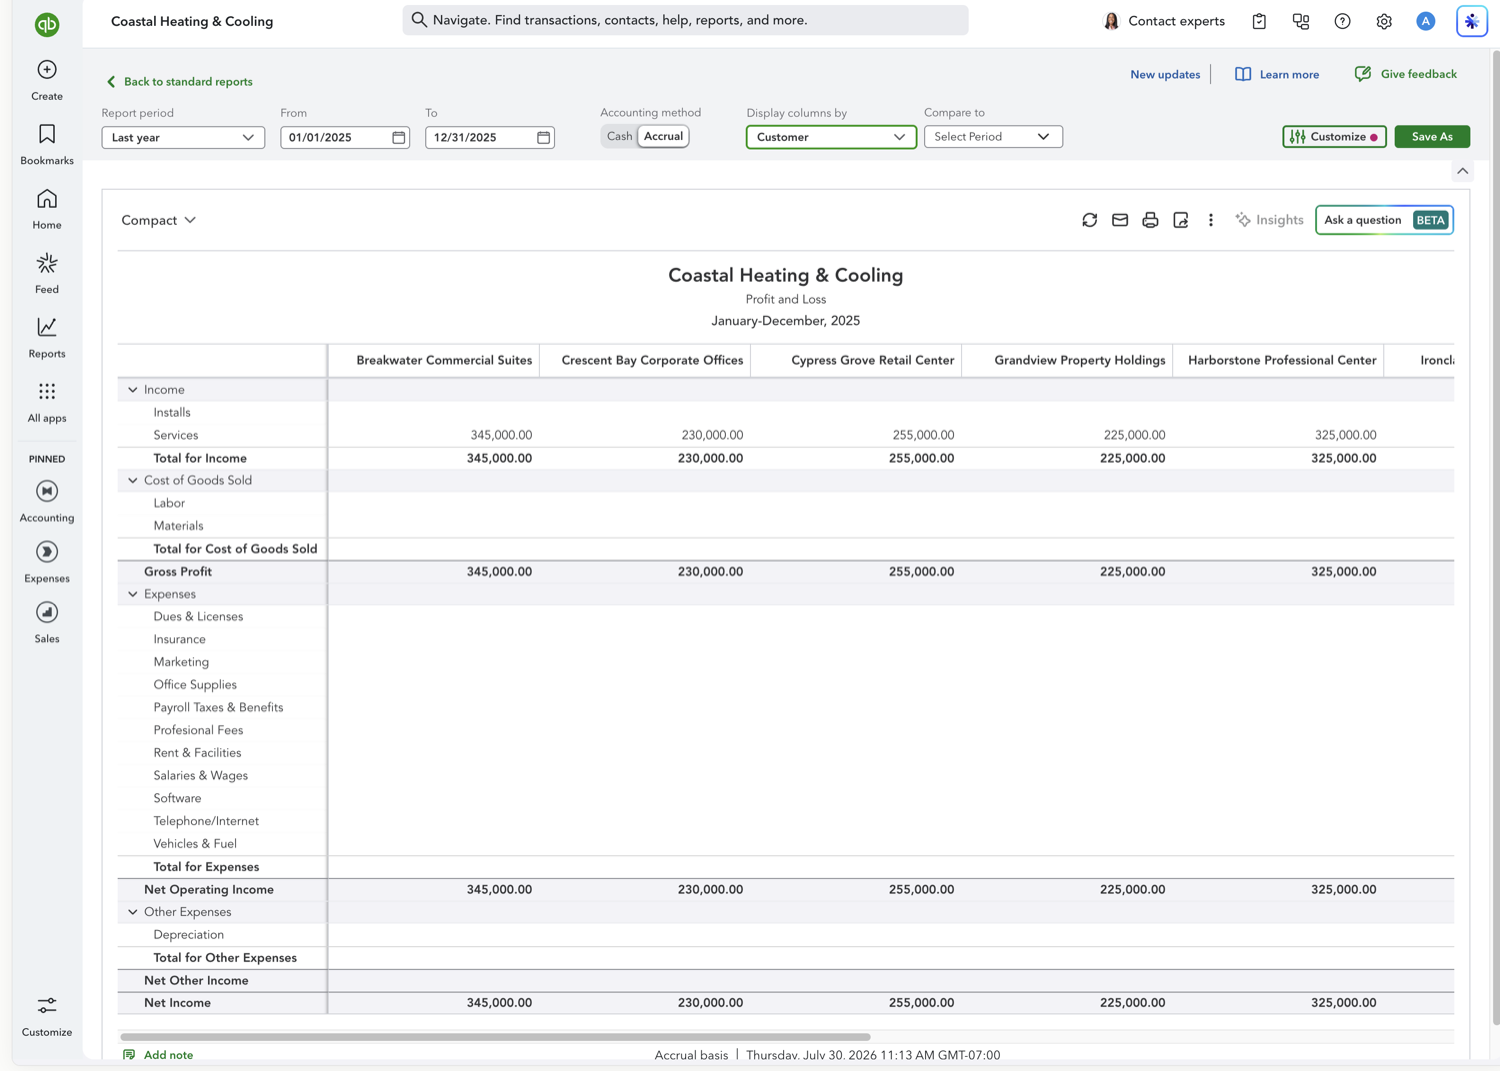
The report updates automatically, showing a customer-by-customer breakdown of income, cost of goods sold, expenses, and net income.
- Filter to a subset of customers (optional)
If you only need a few key accounts, click Customize, open the Filters section, set "Filter by" to Customer, and choose the specific customers you want instead of every customer in the file.
See also
Frequently asked questions
Does this require QuickBooks Online Plus or Advanced?
Class and location tracking require QuickBooks Online Plus or Advanced, but Profit and Loss by Customer is a standard report available on every QuickBooks Online plan.
Why do some expenses not show up under any customer?
Only transactions with a customer assigned to them will be attributed to that customer. Overhead expenses without a customer tag will appear in an unassigned or blank column.
Can I combine this with a by-month breakdown?
QuickBooks Online's report Customize panel only supports one column grouping at a time. To see customer profitability trended by month, you'd need to run the report for each month separately or use a spreadsheet tool that pulls multiple report views together.
Tired of rebuilding reports? Need more customization?
Retriever pulls QuickBooks Online reports like this one into Google Sheets on a schedule. They refresh on their own, and once the data is in Sheets you can pivot, chart, and customize it far beyond QuickBooks' fixed report layouts.
See how Retriever worksRelated report guides
Questions about this report? Reach out at aubrey@retrieverhq.com.

© 2026 Avalon Innovation Corporation. All rights reserved.
🇺🇸 Built in Orange County, California