
How to Create a Profit and Loss Report by Quarter in QuickBooks Online
Quarterly Profit and Loss reports strike a balance between month-level detail and a full annual summary, useful for board updates, investor reporting, or your own quarterly check-ins. Here's how to build one in QuickBooks Online.
New to QuickBooks Online's modern view? See how it compares to the classic view.
Steps
- Open the Profit and Loss report
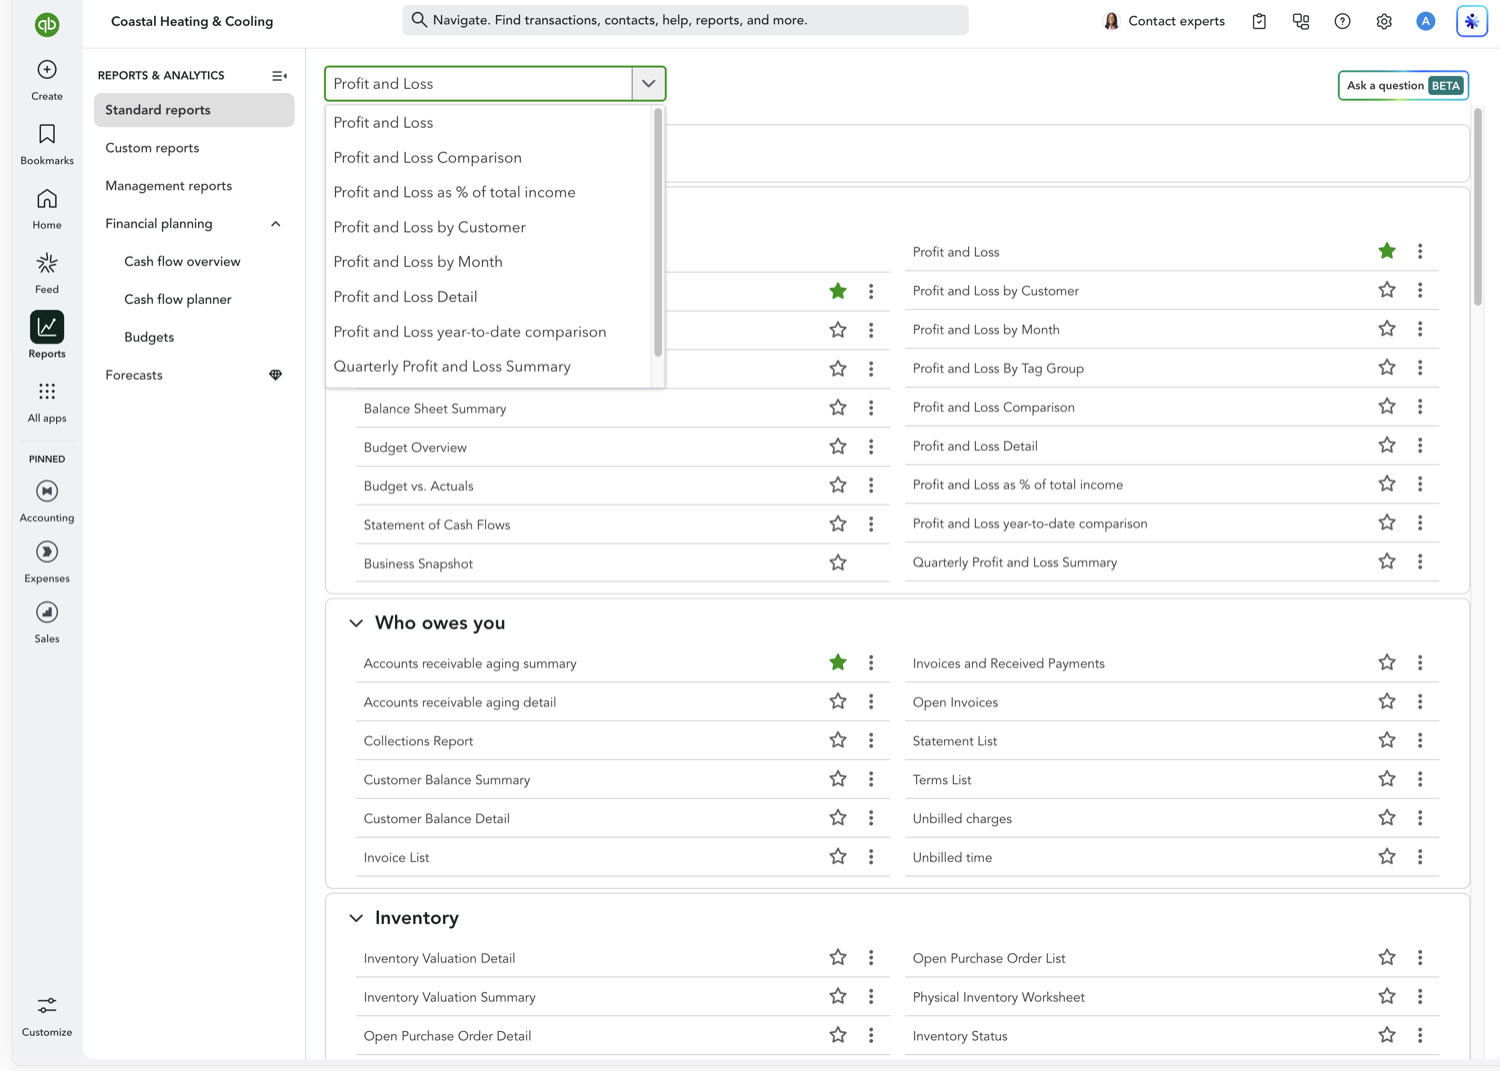
Go to Reports and select "Profit and Loss."
- Set your date range to the full year (or years) you want to compare
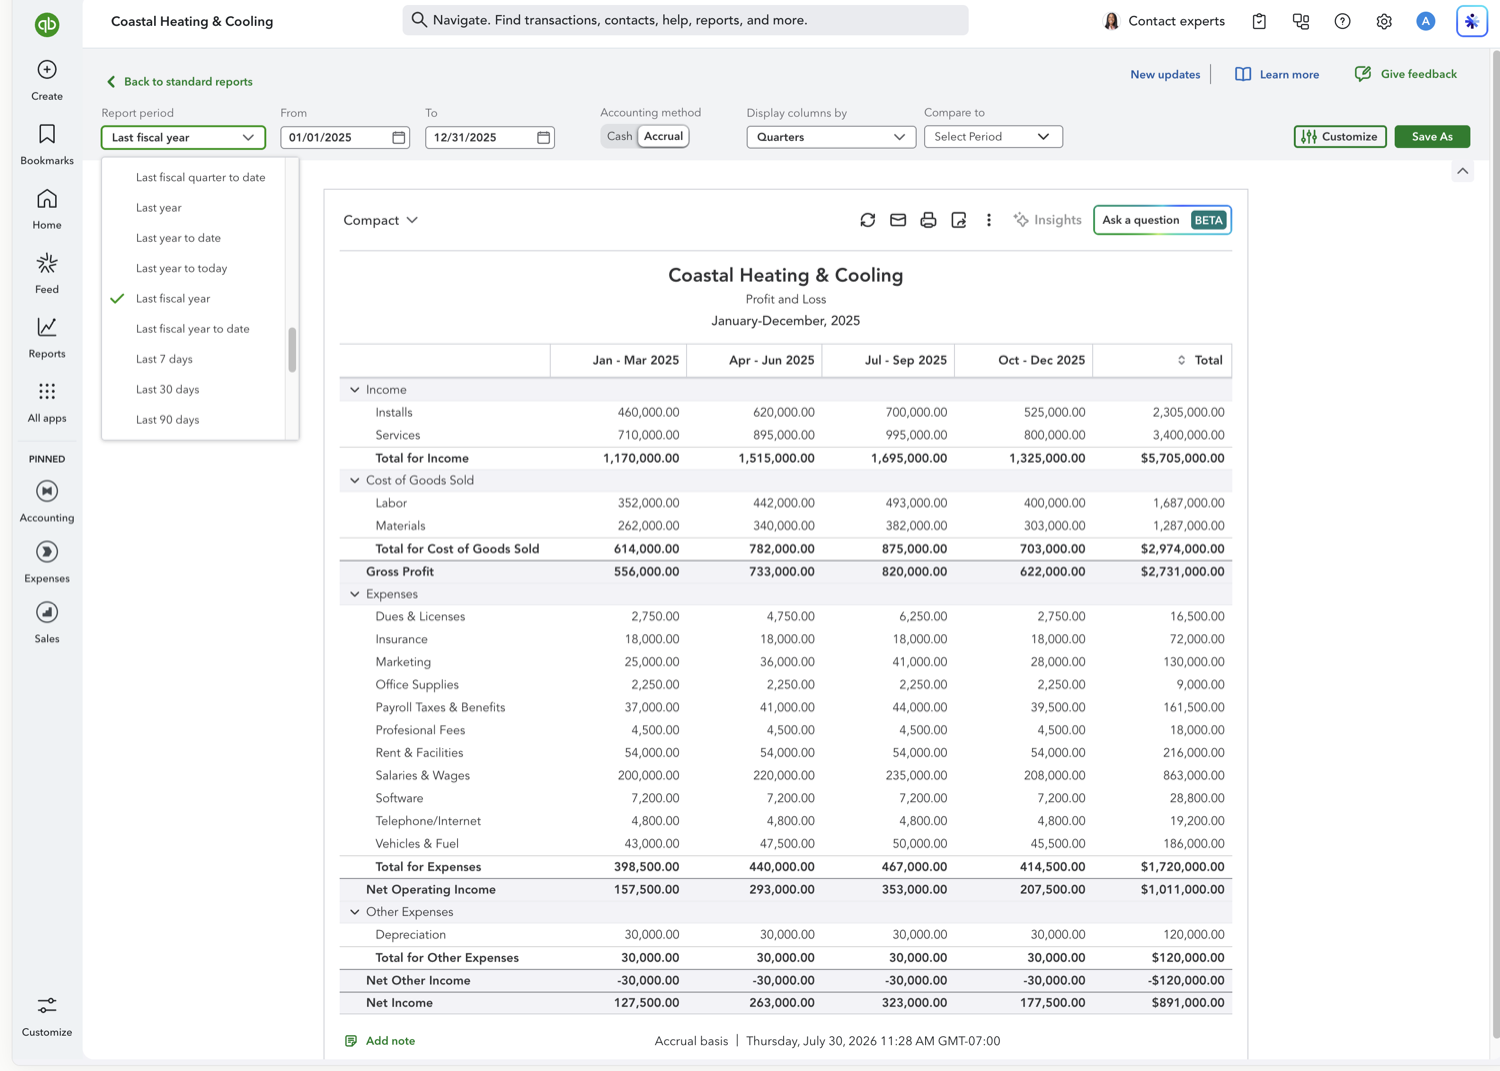
Choose "This Fiscal Year" or a custom range spanning the quarters you want to review.
- Set the report to display columns by Quarters
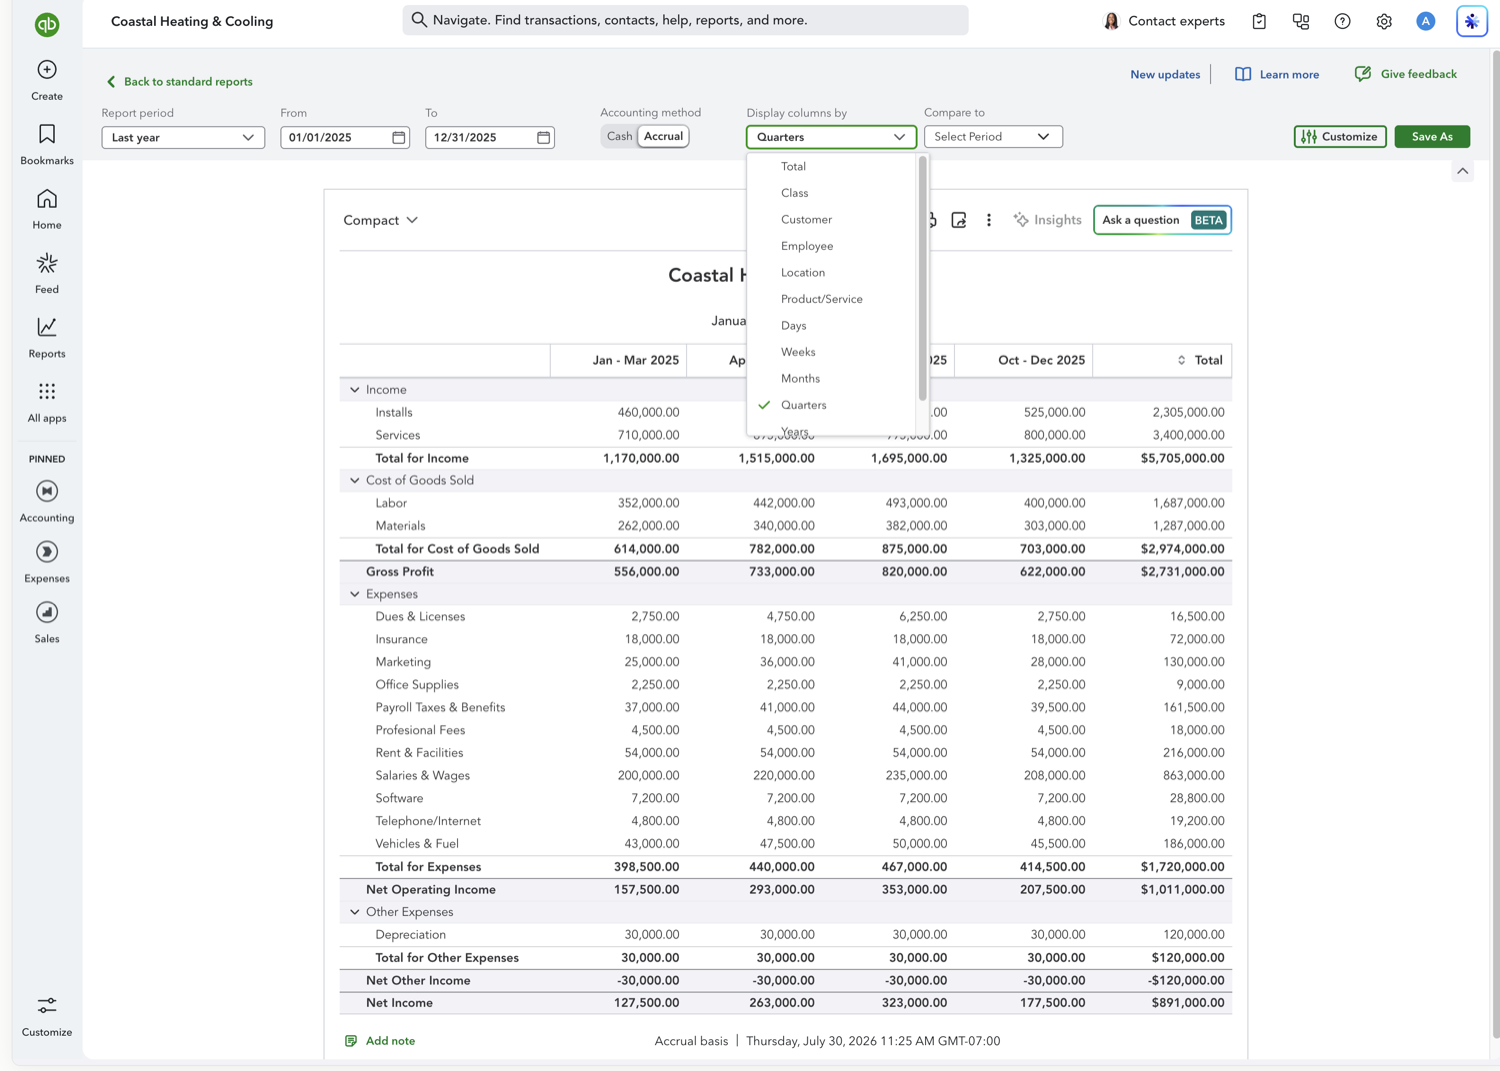
Open the "Display columns by" dropdown at the top of the report and choose Quarters. The report will regroup into four columns (or more, for multi-year ranges).
- Review the quarterly columns
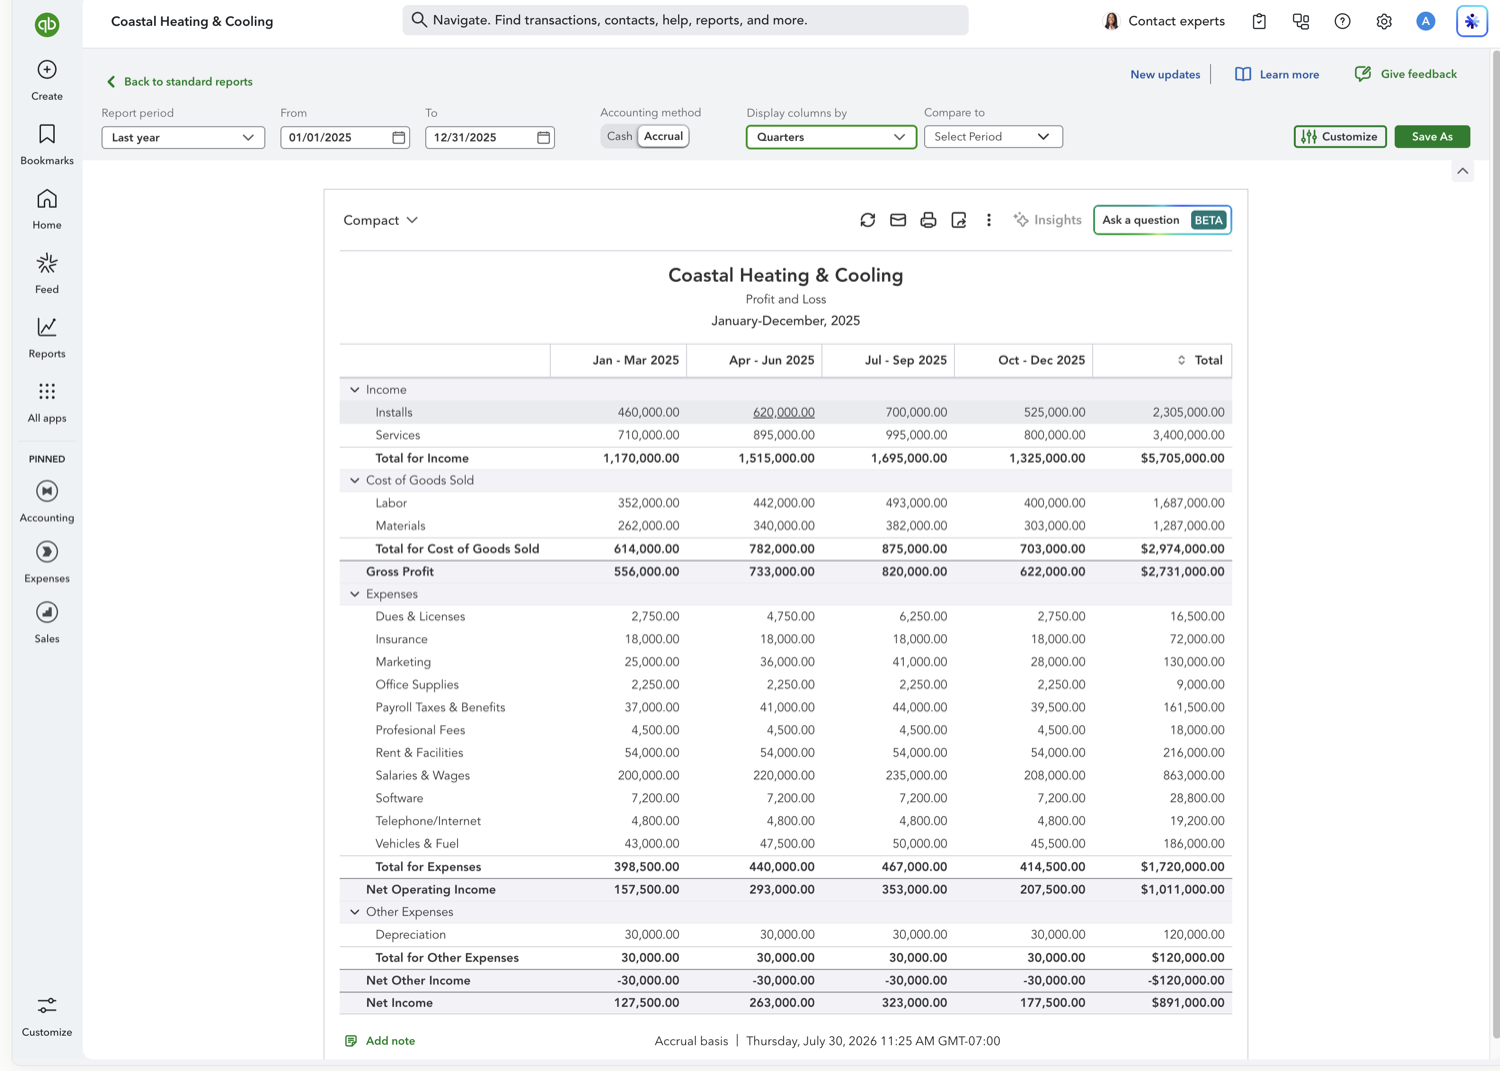
The report updates automatically, showing income, expenses, and net income broken out quarter by quarter, with a Total column on the right.
Frequently asked questions
Does QuickBooks use calendar quarters or fiscal quarters?
QuickBooks Online bases quarters on the fiscal year start date set in Account and Settings > Advanced. If your fiscal year starts in January, quarters align to the calendar; if it starts elsewhere, quarters shift accordingly.
Can I add a percentage-of-total column?
Yes. Open the "Compare to" dropdown at the top of the report (or the Customize panel) and turn on "% of Column" or "% of Income" alongside the quarterly breakdown.
How do I compare this quarter to the same quarter last year?
Use the Comparison / Year-over-Year Profit and Loss setup instead, which adds prior-period and prior-year columns alongside each period.
Tired of rebuilding reports? Need more customization?
Retriever pulls QuickBooks Online reports like this one into Google Sheets on a schedule. They refresh on their own, and once the data is in Sheets you can pivot, chart, and customize it far beyond QuickBooks' fixed report layouts.
See how Retriever worksRelated report guides
Questions about this report? Reach out at aubrey@retrieverhq.com.

© 2026 Avalon Innovation Corporation. All rights reserved.
🇺🇸 Built in Orange County, California