
How to Create a Profit and Loss Report by Location in QuickBooks Online
If you run multiple stores, offices, or job sites, a Profit and Loss by Location report shows you which locations are actually profitable, and which ones are dragging on the business. Here's how to build one in QuickBooks Online.
This report needs location tracking turned on first. See how to turn on location tracking.
New to QuickBooks Online's modern view? See how it compares to the classic view.
Steps
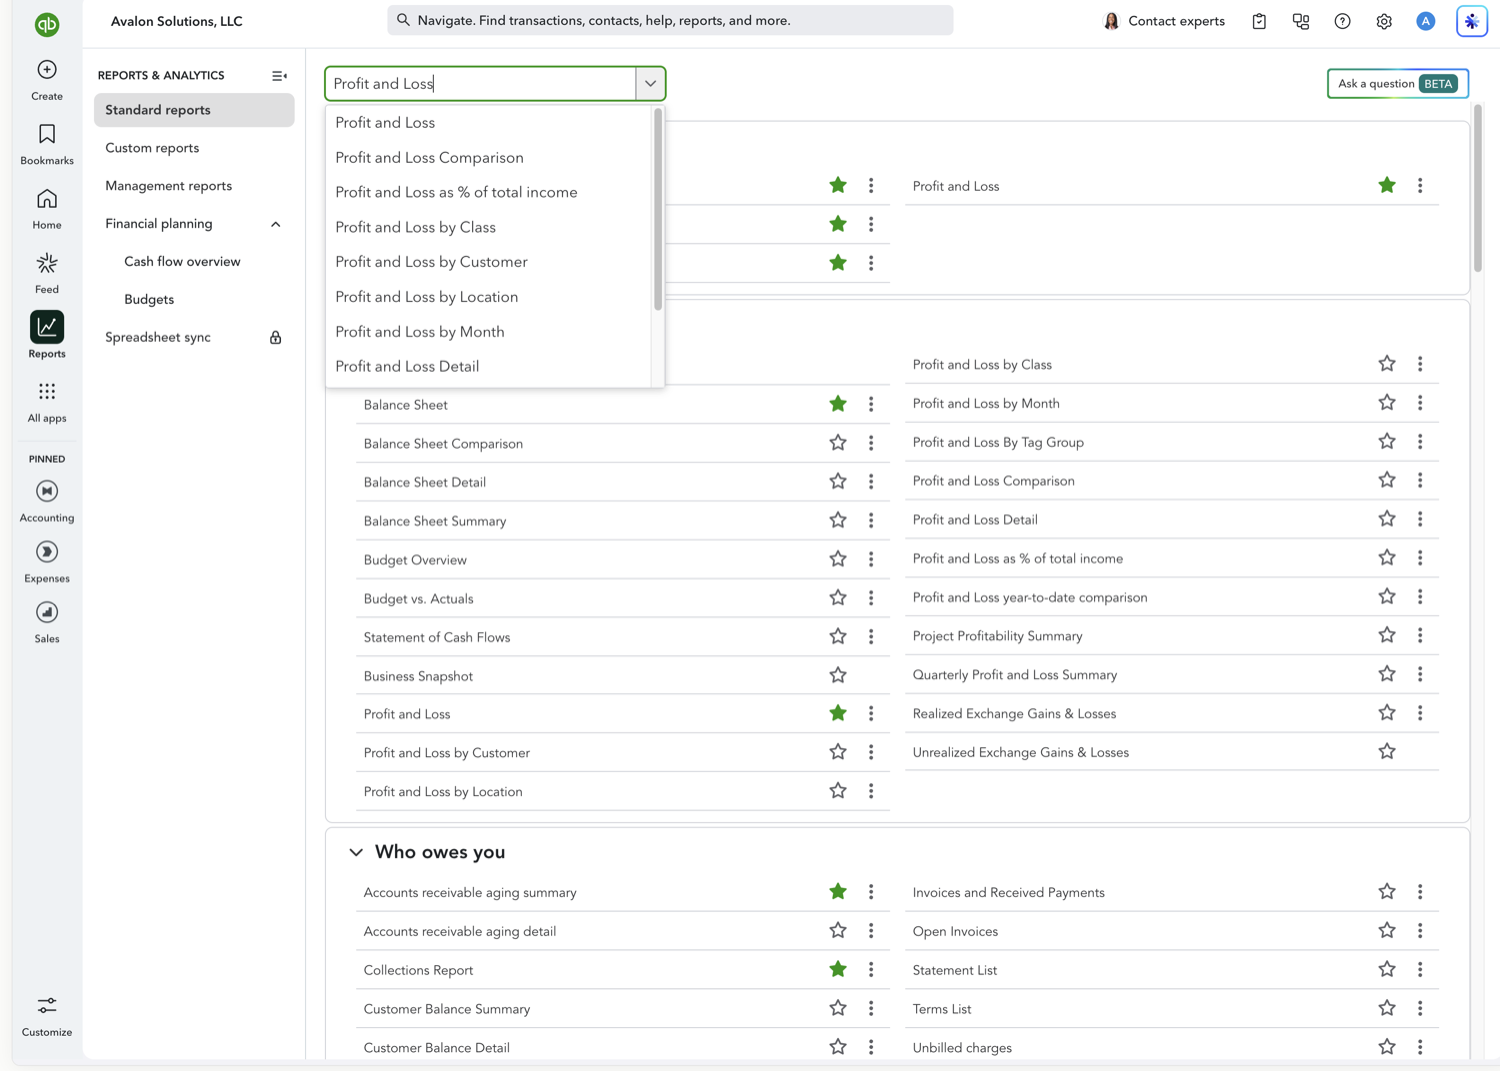
- Open the Profit and Loss report
Go to Reports and select "Profit and Loss."
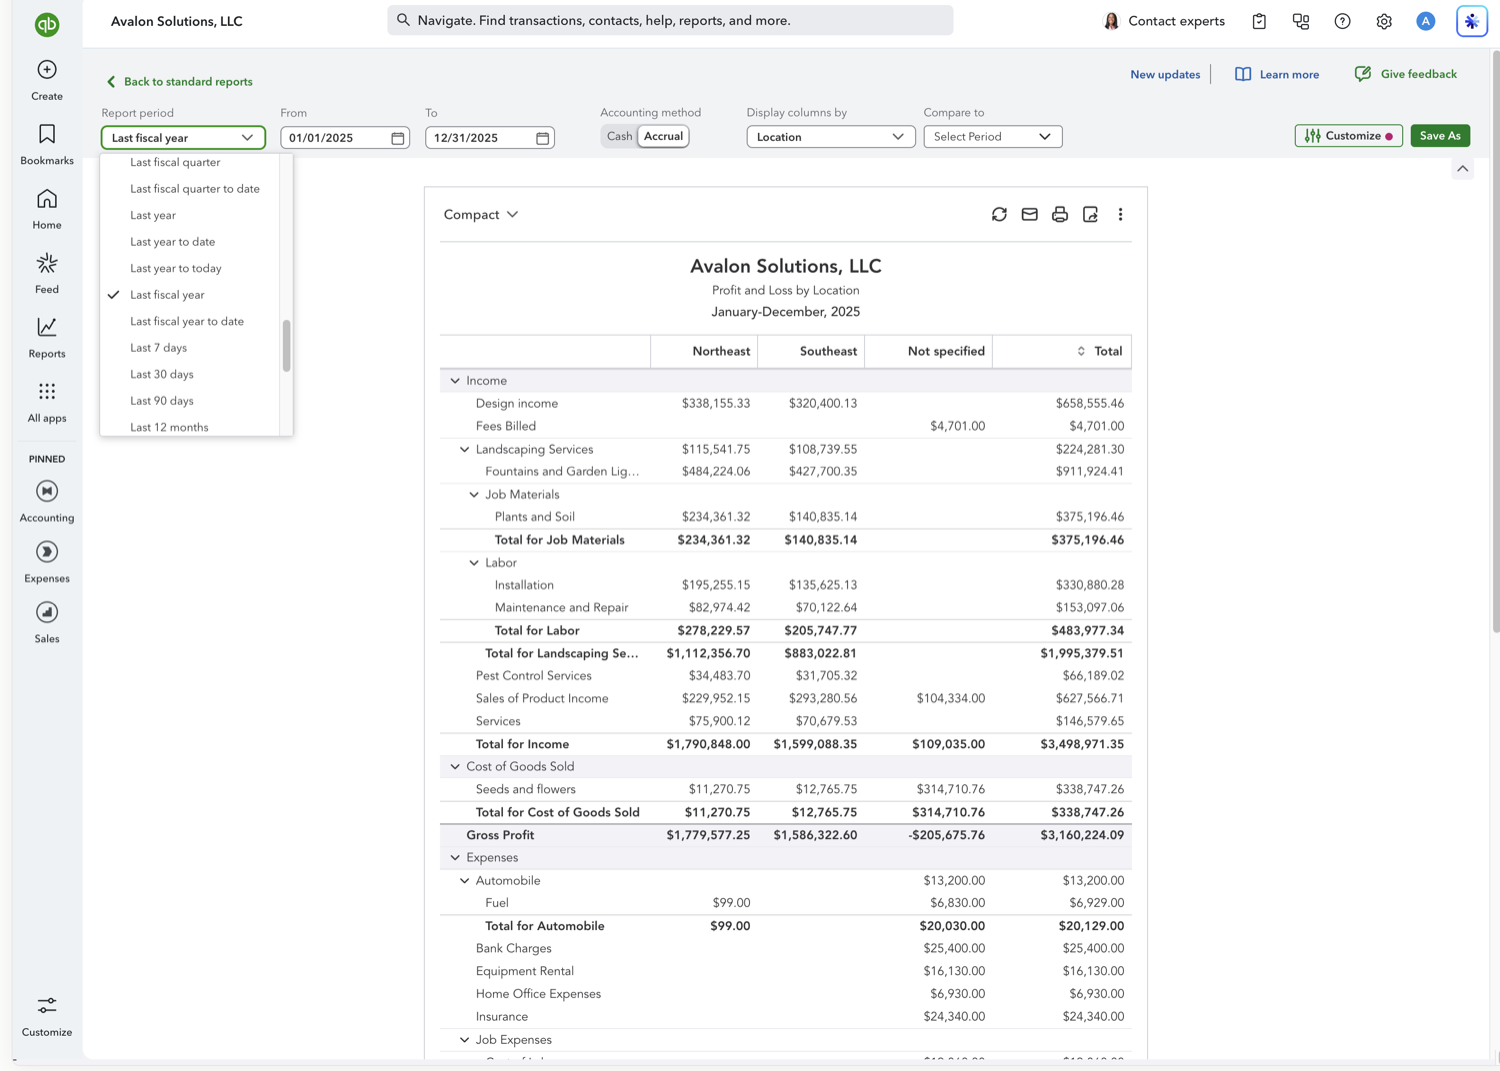
- Set your reporting period
Choose the date range you want the location breakdown to cover.
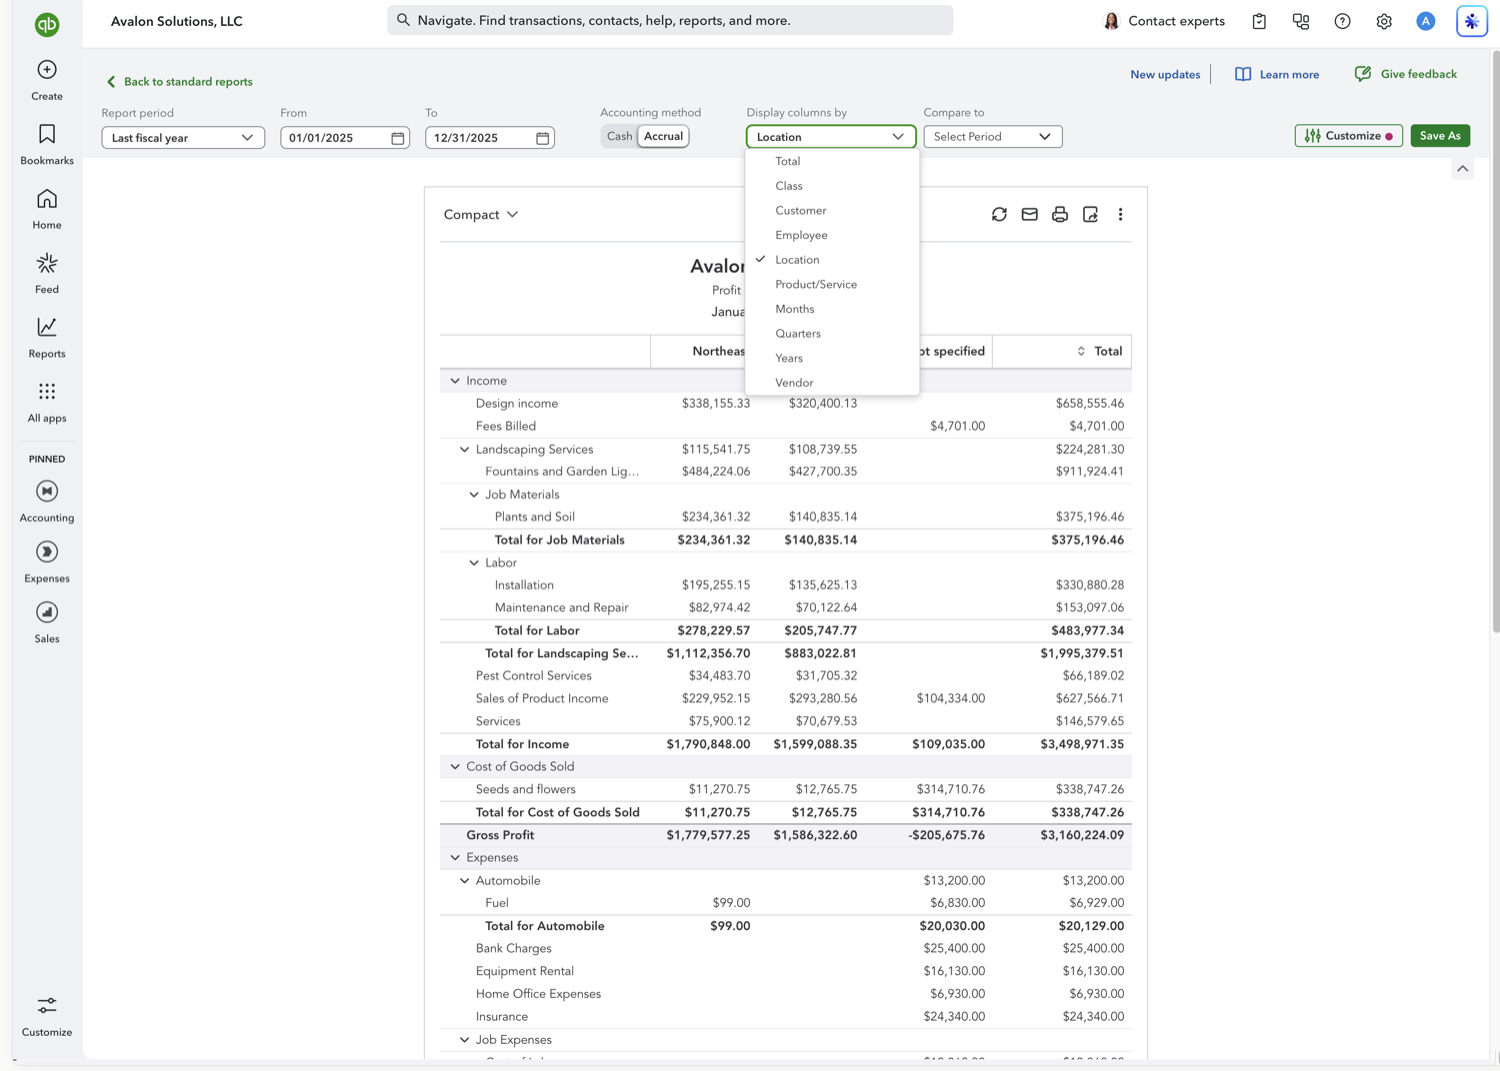
- Set the report to display columns by Location
Open the "Display columns by" dropdown at the top of the report and choose Location. The report will split into one column per location, plus a "Not specified" column for unassigned transactions.
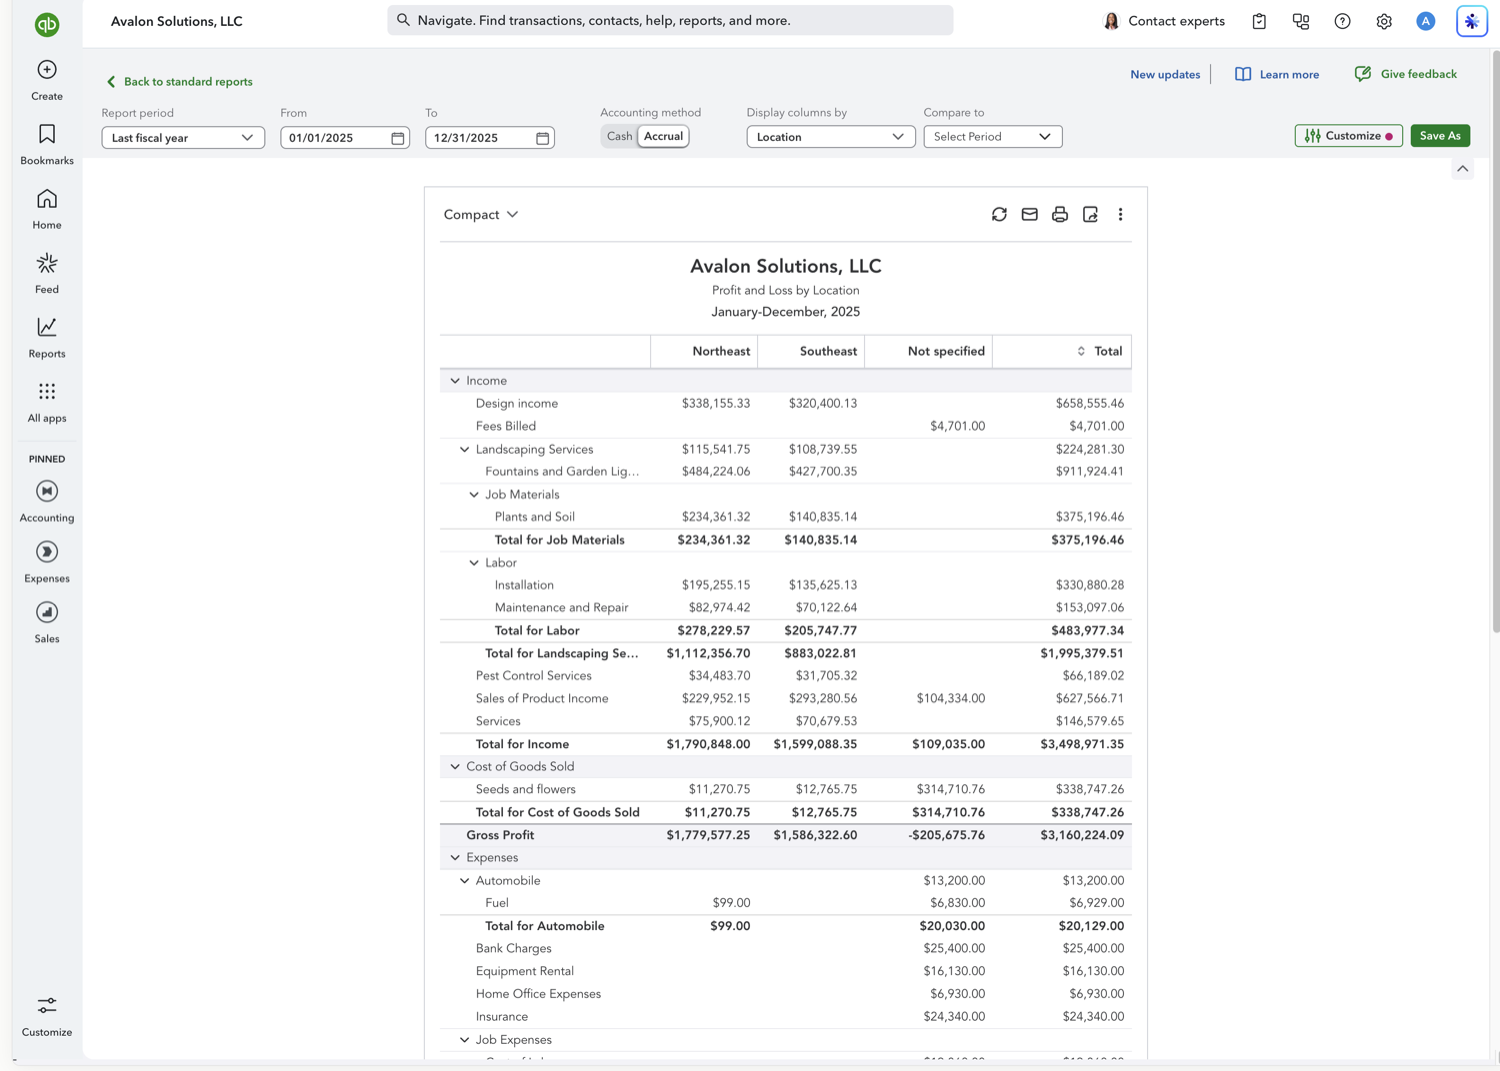
- Review the location columns
The report updates automatically, letting you compare income, expenses, and net income across every location side by side.
See also
Frequently asked questions
Can I use both Location and Class tracking at the same time?
Yes, QuickBooks Online lets you enable both, but a single report's columns can only be grouped by one of them at a time. You'd run separate report views for each, or add the other as a filter.
What happens to overhead expenses that apply to every location?
Shared overhead won't automatically split across locations. It will land in whichever location (or the Not specified column) the transaction was tagged with. Some businesses handle this with a manual allocation journal entry.
Does location tracking cost extra?
No additional cost, but it does require QuickBooks Online Plus or Advanced. It's not available on Simple Start or Essentials.
Tired of rebuilding reports? Need more customization?
Retriever pulls QuickBooks Online reports like this one into Google Sheets on a schedule. They refresh on their own, and once the data is in Sheets you can pivot, chart, and customize it far beyond QuickBooks' fixed report layouts.
See how Retriever worksRelated report guides
Questions about this report? Reach out at aubrey@retrieverhq.com.

© 2026 Avalon Innovation Corporation. All rights reserved.
🇺🇸 Built in Orange County, California