
How to drill down on a Profit and Loss by Customer
You can now drill into a cell on a Profit and Loss, Balance Sheet, or Cash Flow when the columns are customers, classes, locations, or vendors. Previously, it worked only with date columns. Drill down also works on Budget vs. Actualswhen you select a cell in an Actual column.
If you've ever run a P&L by Customer, you already know the layout: accounts down the left, one column per customer, a dollar amount at each intersection. Until now, Retriever's drill-down treated those columns as periods, so a click on "Cooler Cars" had nothing to work with. Select that same cell today, hit Refresh, and you get the invoices that make up the number.
How to drill down
- Open a supported report
Use a Profit and Loss, Balance Sheet, Cash Flow, or Budget vs. Actuals whose Display columns by is set to Customers, Vendors, Classes, or Departments/Locations. On Budget vs. Actuals, select a cell in an Actual column. Reports you already created this way work as they are. You don't need to rebuild them.
- Select the cell
Click the intersection of an account (or a section total like Total Income) and a customer, class, location, or vendor column. In the example below, that's Design income for Cooler Cars.
- Refresh drill-down
Open Retriever, go to the Drill down tab, and click Refresh. Retriever pulls live QuickBooks transactions for that account and that column, over the report's date range.
That's the same select-then-Refresh flow as a P&L by month. The only change is that the column can be a name instead of a period.
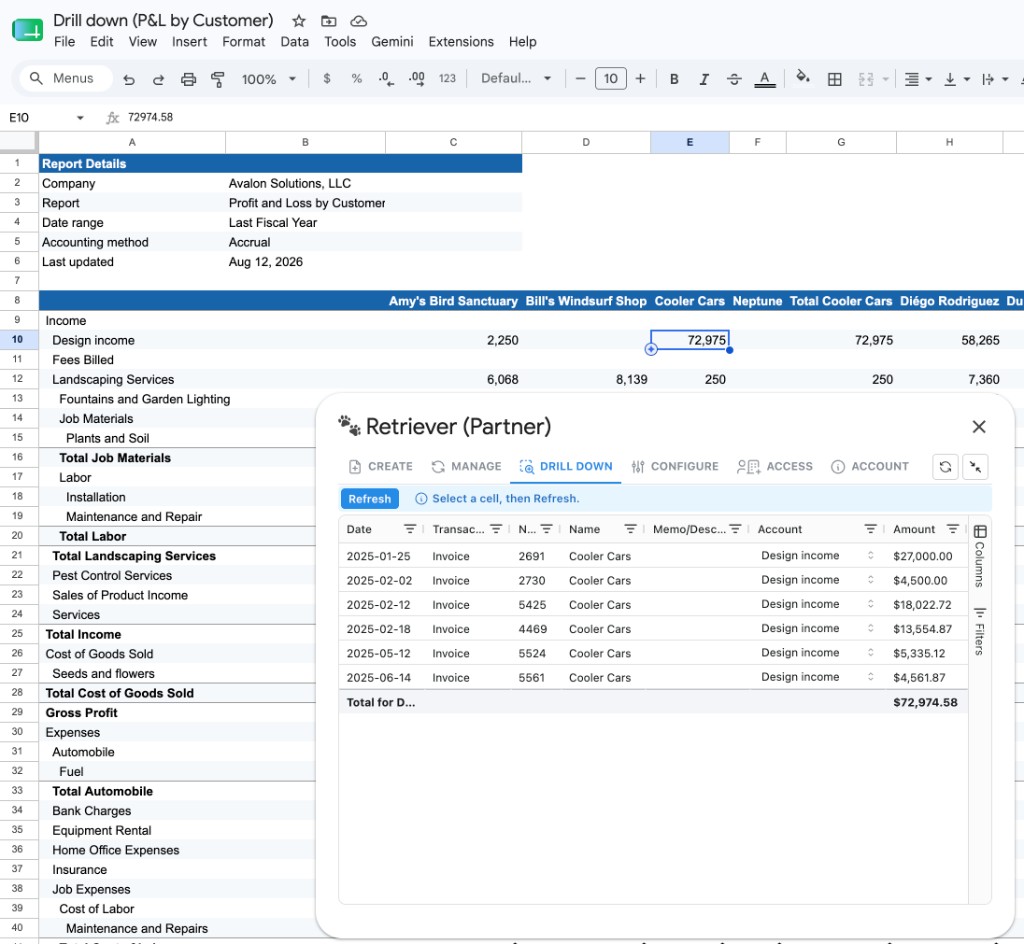
What you see
The grid is the transaction list behind that cell. Date, transaction type, number, name, memo, and amount are visible by default. Use Columns to show Location, Vendor, Split, Balance, or Account, and Filters to narrow the list.
The footer is the total for the selection. On a Profit and Loss or Cash Flow that's period activity, so it should match the cell. On a Balance Sheet it includes beginning balance, so it matches the ending-balance cell.
The date range is the report's range (Last Fiscal Year in the screenshot), not a column period, because these columns aren't dates. Accounting method and any other filters on the report stay in place.
Parent columns vs Total columns
QuickBooks often prints two columns for a parent customer, class, or location:
- Cooler Cars is that customer's own activity. Jobs and sub-customers are left out.
- Total Cooler Cars is the parent plus every job and sub-customer under it.
Click the column that matches the number you want to inspect. The far-right Total column drills the whole report: every entity in the report's filters, for the full date range.
What you can click, and what you can't
This works on individual accounts, account totals, and real section totals such as Total Income, Total Expenses, or Total Current Assets. On Budget vs. Actuals, it works on Actual columns only.
Does not work on calculated rows (Gross Profit, Net Income), Total Equity on the Balance Sheet (it includes Net Income), or the Not Specified column. QuickBooks can't filter a General Ledger by unassigned transactions, so pick a named column instead.
Frequently asked questions
Do I need to recreate my existing reports?
No. Reports you already built with Display columns by Customer, Class, Location, or Vendor drill down as they are. Recreate a report only if two QuickBooks records share the same name and Retriever asks you to, or if you rename one and refresh.
Which reports and column types are supported?
Profit and Loss, Balance Sheet, Cash Flow, and Budget vs. Actuals (Actual columns), when Display columns by is Customers (or your company's word for it: Clients, Donors, Members), Vendors, Classes, or Departments/Locations. Date columns (days, weeks, months, quarters, years) still drill the way they always have.
Does this work on Budget vs. Actuals?
Yes. Select a cell in an Actual column, including when the report is summarized by customer, class, location, or vendor. Budget, Over Budget, and % of Budget cells do not drill, because those numbers are not transactions.
What about Employees or Products/Services?
Those Display columns by options are unchanged. Drill-down on those columns is not part of this release.
Does this work on P&L Comparison?
Only Current / Total columns, not a specific customer or class column. Budget reports don't have drill-down.
Can a Viewer use this?
Yes. Anyone who can refresh and drill down can use it, including clients you invited as Viewers.
See the transactions behind any cell
Retriever puts QuickBooks Online reports in Google Sheets and refreshes them on a schedule. Select a cell, including one under a customer, class, location, or vendor column (or an Actual column on Budget vs. Actuals), and drill into the transactions without leaving the spreadsheet.
See how Retriever worksSee also
Questions about drill-down? Reach out at aubrey@retrieverhq.com.

© 2026 Avalon Innovation Corporation. All rights reserved.
🇺🇸 Built in Orange County, California