
How to Run a Balance Sheet Comparison in QuickBooks Online
A Balance Sheet Comparison puts your current position next to a prior year or period so you can see how much cash, receivables, debt, and equity have changed. Here's how to build one (and add the $ change and % change columns) in the modern view.
New to QuickBooks Online's modern view? See how it compares to the classic view.
Steps
- Open the Balance Sheet report
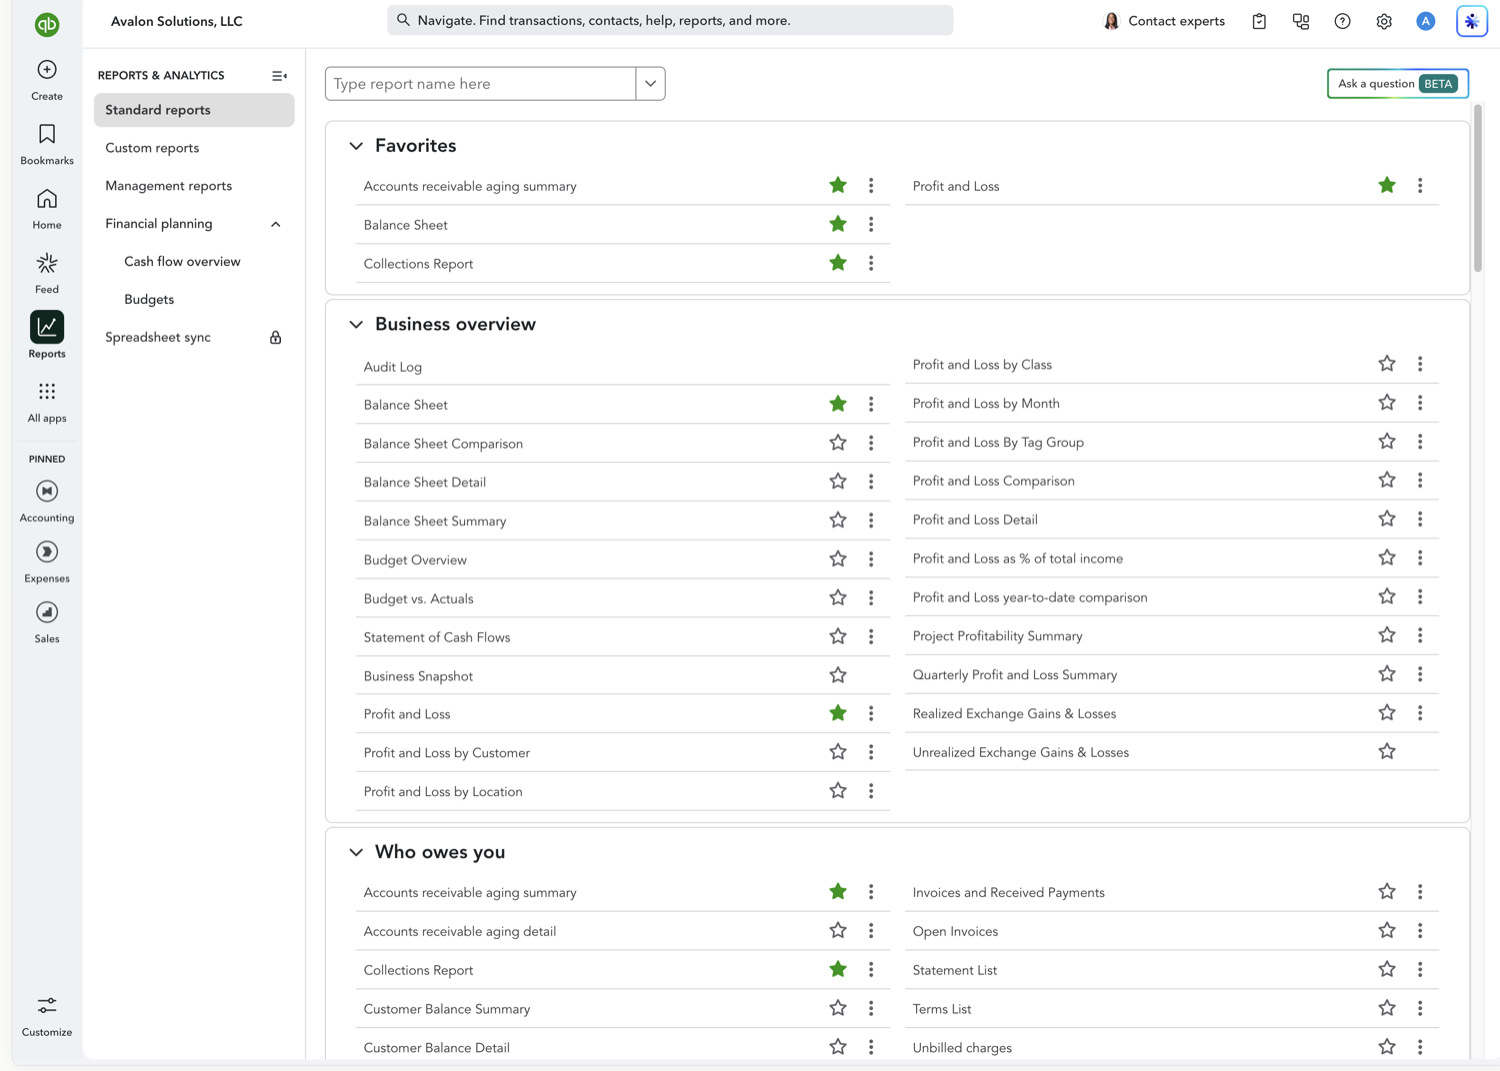
Go to Reports and, under Business overview, open "Balance Sheet." (There is also a ready-made "Balance Sheet Comparison" report in the same list that opens with the prior-year column already added.)
- Open the "Compare to" dropdown
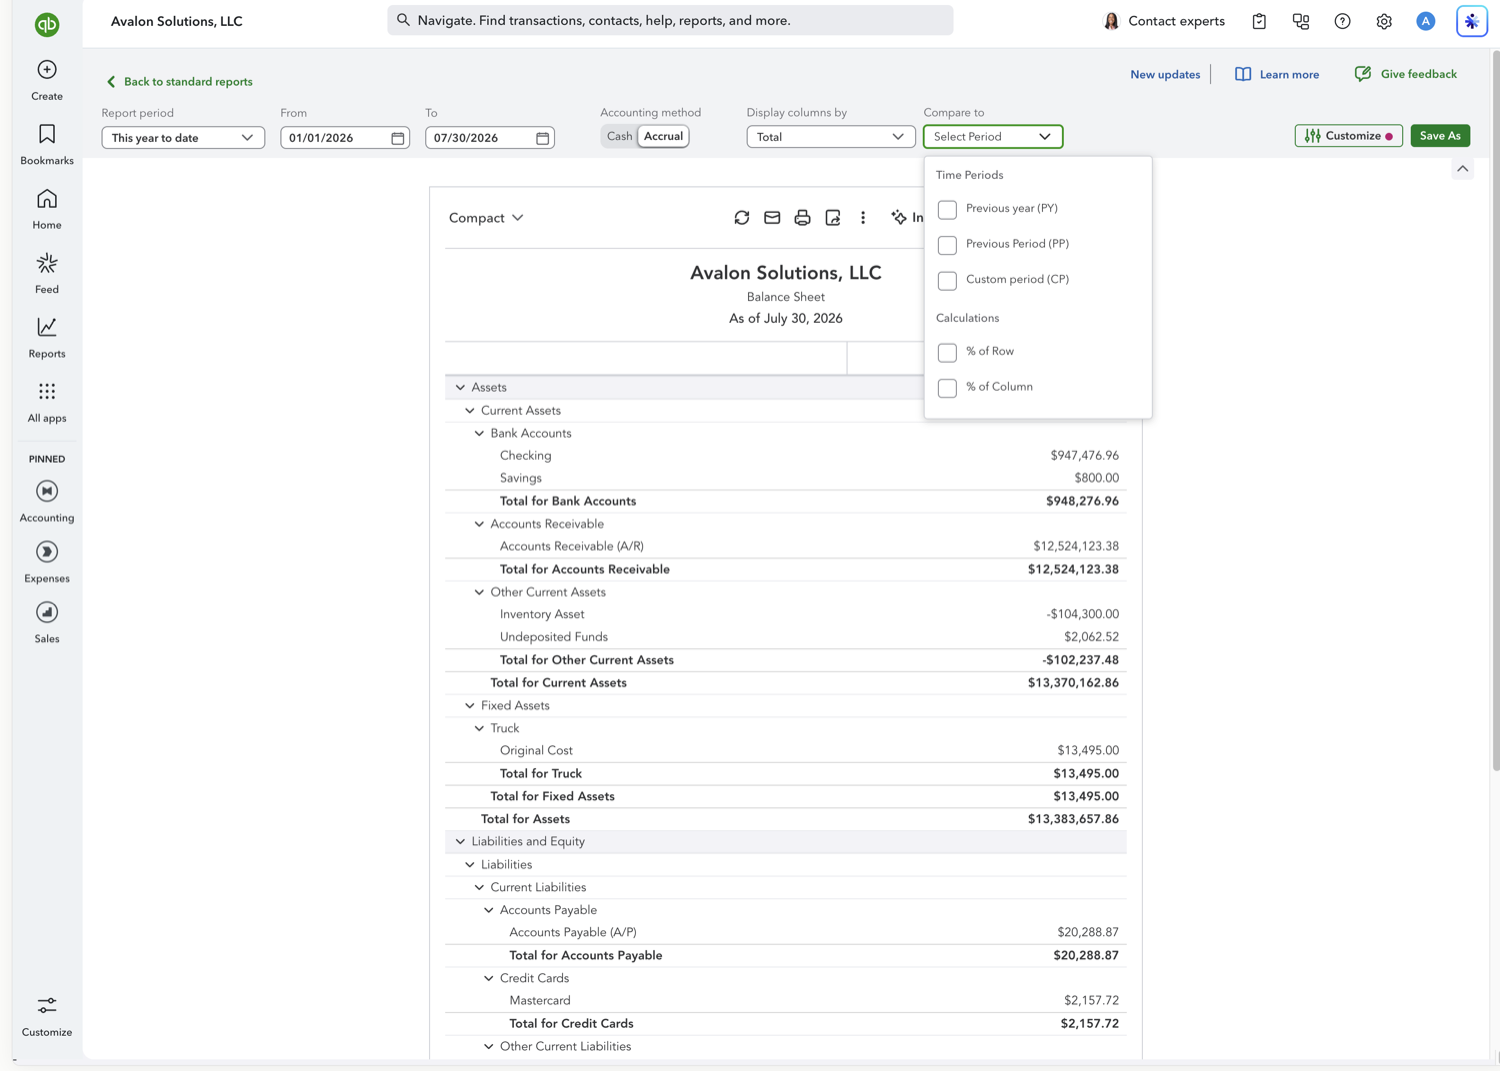
Set your as-of date, then open the "Compare to" dropdown. Choose a comparison period (Previous year, Previous Period, or a Custom period), and QuickBooks adds a second column as of that earlier date.
- Add change columns and review
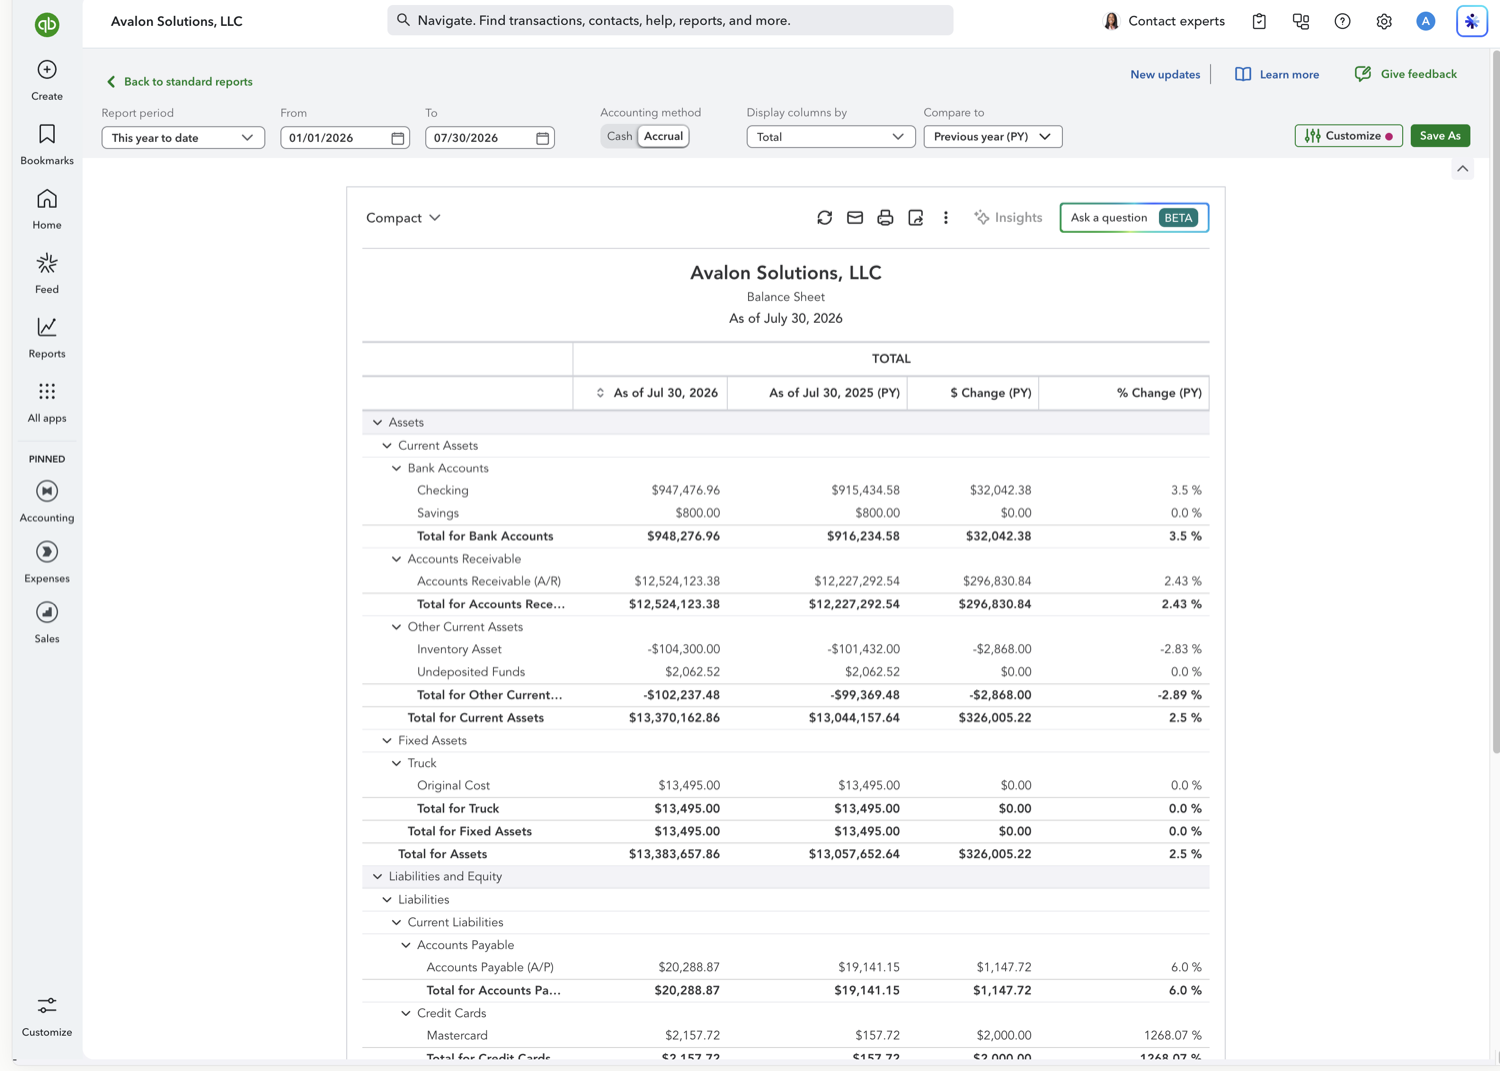
With a comparison period selected, tick $ change and % change to see the dollar and percentage movement in every account. The report shows both dates side by side plus the change columns.
Comparison periods and calculation columns
The "Compare to" dropdown offers three comparison periods plus calculation columns you can layer on top:
Previous year (PY) — Adds a column as of the same date one year earlier.
Previous Period (PP) — Adds a column as of the end of the prior period of the same length as your report range.
Custom period (CP) — Adds a column as of any date you choose.
$ change — The dollar difference between the current date and the comparison date.
% change — The percentage difference between the current date and the comparison date.
% of Row — Shows each amount as a percentage of its row total.
% of Column — Shows each amount as a percentage of its column total.
See also
Frequently asked questions
How many periods can I compare on a Balance Sheet?
The modern view adds one comparison period at a time (previous year, previous period, or a custom date). To compare three or more dates side by side, pull the report into Google Sheets. See the linked guide.
Why is the comparison column dated differently than my report period?
A Balance Sheet is an as-of snapshot, so the comparison column is dated as of the end of the prior period. For a Previous year comparison it's the same date one year earlier.
Tired of rebuilding reports? Need more customization?
Retriever pulls QuickBooks Online reports like this one into Google Sheets on a schedule. They refresh on their own, and once the data is in Sheets you can pivot, chart, and customize it far beyond QuickBooks' fixed report layouts.
See how Retriever worksRelated report guides
Questions about this report? Reach out at aubrey@retrieverhq.com.

© 2026 Avalon Innovation Corporation. All rights reserved.
🇺🇸 Built in Orange County, California